Camera and Vertical Stacked Charts Slide
RJ0500021_8
- Last Update 06/12/2025
- File Size 0.8MB
- # of Slides 2
- File Format PPTX
- Slide Ratio 16:9
- Color
Keywords
- #Content-Based Slides
- #Design-Based Slides
- #Business Strategy
- #Financial Plans and Performance
- #Graph
- #Other
- #Achievements
- #Sales and Revenue
- #Column
- #Grouped Column
- #16:9
- #vertical stacked bar chart PowerPoint
- #data comparison slide template
- #financial analysis presentation
- #camera mockup slide
- #how to create stacked bar chart in PowerPoint
About the Product
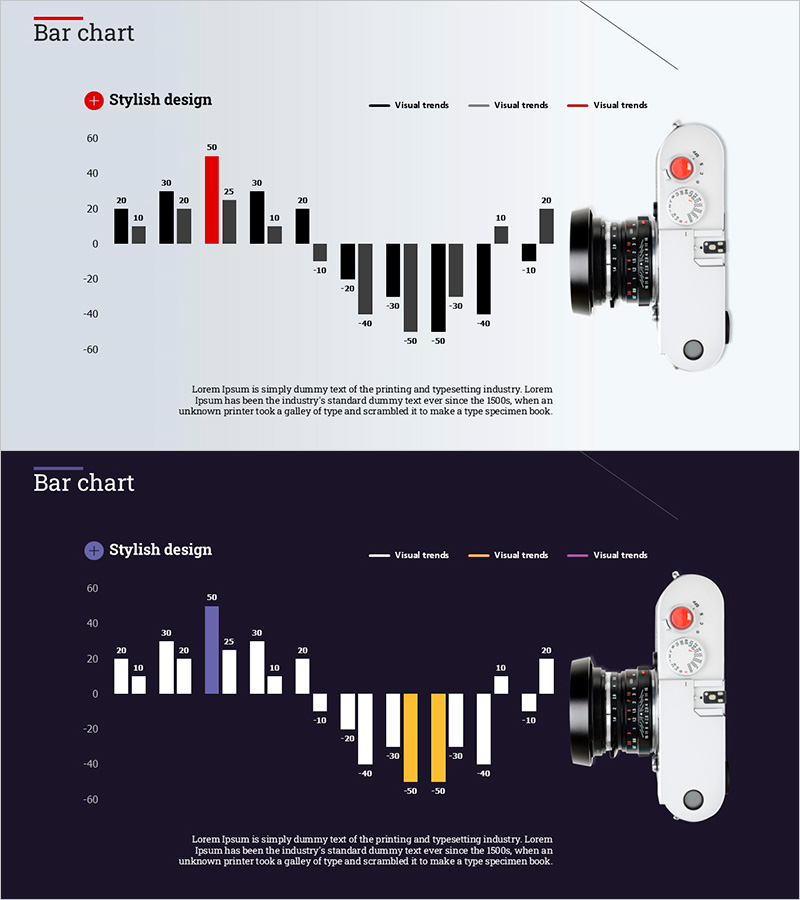
A professional vertical stacked bar chart PowerPoint slide set designed for comparing financial data, performance metrics, and product specifications. This 2-slide presentation template features both light and dark background versions, each with an integrated camera mockup image for product showcase and technical specification presentations. The charts display three data series using black, red, and gray bars, with support for negative values to represent losses, decreases, or variances. Fully editable and ready to use in business reports, proposals, investor pitches, and marketing presentations.
Usage Points
-
Main Usage
Display and compare three or more data series side-by-side using vertical stacked bars. The integrated camera mockup image allows you to showcase product specifications, technical performance, or equipment features alongside numerical data. Supports both positive and negative values for comprehensive data visualization in financial, technical, and sales presentations.
-
How to Use
Slide 1 features a light gray background while Slide 2 uses a dark background for versatility. Simply edit the bar heights and colors to input your actual data, then update the legend and axis labels. Replace the camera mockup with your own product image or keep it as-is. Adjust the color scheme to match your presentation theme or corporate branding guidelines.
-
Recommended For
Ideal for product technology presentations, financial reports, sales performance analysis, marketing ROI reports, investor relations meetings, executive briefings, and consulting proposals. Particularly effective for camera, lens, optical equipment, electronics, and IT technology companies presenting product specifications alongside performance metrics.
-
Slide Structure
Each slide contains one vertical stacked bar chart with three data series (black, red, and gray bars) arranged side-by-side. A camera mockup image is positioned on the right side of the chart. Title area at top-left, descriptive text area at bottom. Supports negative value display for above/below zero data representation.
Related Products
-

KPI Target vs Actual Slide – 4-Metric Dark Red & Purple
#Company Introduction #Business Strategy #Financial Plans and Performance
-

Food Ingredient Graph – Family Recipe Data Visualization
#Business Strategy #Financial Plans and Performance #Graph
-

Bundled Vertical Bar Graph Blue Green – Market and Customer Analysis
#Market and Competitor Analysis #Financial Plans and Performance #Graph
-

Leather Material Map Template - Global Network Visualization
#Company Introduction #Financial Plans and Performance #Graph
