Four Color Infographic Bar Chart Presentation Template for Financial Analysis
RJ0200037_7
- Last Update 04/08/2025
- File Size 0.4MB
- # of Slides 2
- File Format PPTX
- Slide Ratio 16:9
- Color
Keywords
- #Content-Based Slides
- #Design-Based Slides
- #Market and Competitor Analysis
- #Financial Plans and Performance
- #Graph
- #Industry Trends
- #Sales and Revenue
- #Column
- #Grouped Column
- #16:9
- #grouped bar chart PowerPoint
- #financial analysis presentation slide
- #four-color infographic chart
- #comparison analysis template
- #how to create grouped bar chart in PowerPoint
About the Product
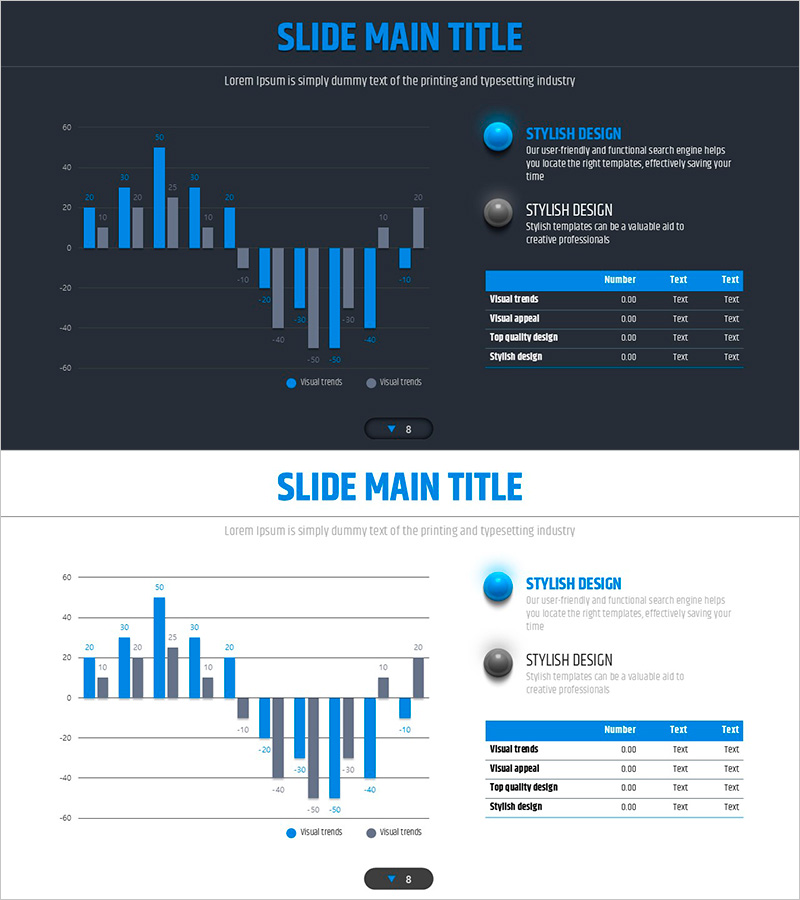
A grouped bar chart PowerPoint slide optimized for financial performance analysis and market trend comparison. Features a dark background with bright blue four-color bars that effectively display positive and negative data simultaneously. The 2-slide set accommodates various presentation scenarios, with an information panel on the right side containing key metrics and descriptions for clear data interpretation. Provided in fully editable PPTX format—simply input your figures and present immediately.
Usage Points
-
Main Usage
Visualizes financial performance analysis, market trend comparison, quarterly and annual results contrast, and departmental or product performance benchmarking by displaying multiple data sets on a single slide. Simultaneously represents positive and negative values to convey growth and decline trends intuitively.
-
How to Use
Insert into financial reports, quarterly earnings presentations, marketing performance analyses, and business plan presentations where numerical comparison is required. Enter metric names and figures in the right information panel, then adjust bar heights to reflect your data.
-
Recommended For
Finance teams, executives, marketing managers, business development professionals, and consultants who need to communicate quantitative analysis results persuasively to senior management and external stakeholders.
-
Slide Structure
Two-slide set with dark background and blue four-color grouped bars centered on each slide. Right side includes two circular icons and an information table with Number, Text, and Test columns. Legend and axis labels support data interpretation.
Related Products
-

Idea Presentation Template for Visualizing Sales Status – Success and Challenge
#Market and Competitor Analysis #Financial Plans and Performance #Graph
-

Bundled Vertical Bar Graph Blue Green – Market and Customer Analysis
#Market and Competitor Analysis #Financial Plans and Performance #Graph
-

Clustered Column Slide Template for Market Trends and Analysis
#Market and Competitor Analysis #Graph #Market Analysis
-

Triangle Pattern Column Chart Presentation Template
#Market and Competitor Analysis #Financial Plans and Performance #Diagram
