Bundled Vertical Bar Graph Blue Green – Market and Customer Analysis
RJ0600027_9
- Last Update 06/27/2025
- File Size 0.3MB
- # of Slides 2
- File Format PPTX
- Slide Ratio 16:9
- Color
Keywords
- #Content-Based Slides
- #Design-Based Slides
- #Market and Competitor Analysis
- #Financial Plans and Performance
- #Graph
- #Other
- #Customer Analysis
- #Sales and Revenue
- #Column
- #Grouped Column
- #16:9
- #bundled vertical bar chart PowerPoint
- #grouped bar graph slide template
- #market analysis chart
- #customer segmentation data visualization
- #comparative data presentation
About the Product
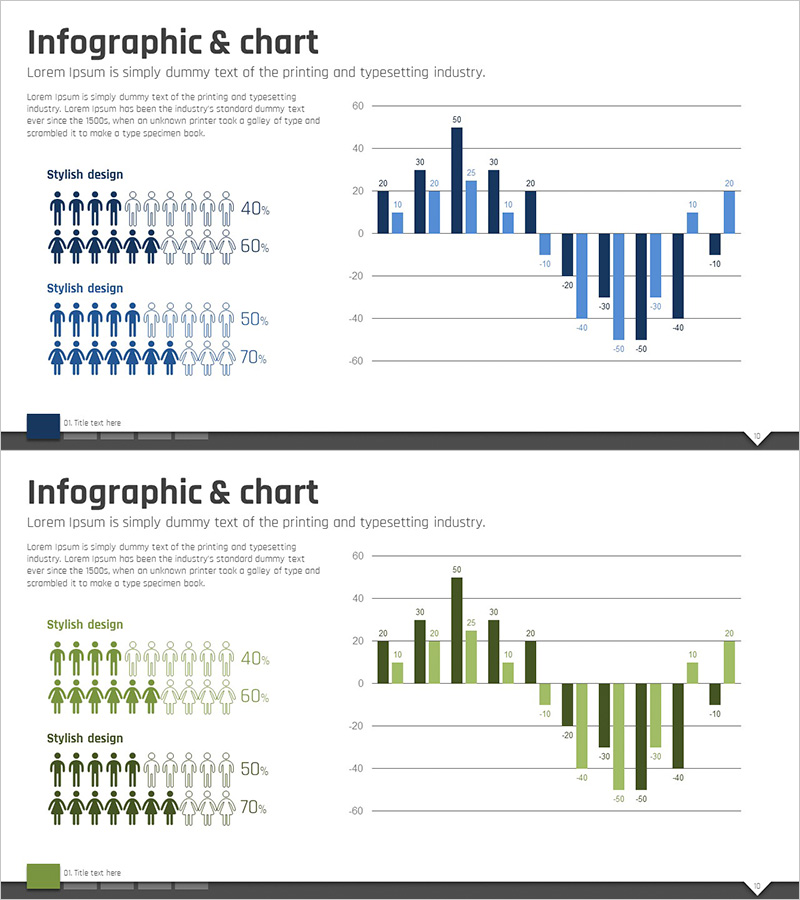
A bundled vertical bar chart PowerPoint slide optimized for market analysis and customer segmentation presentations. This slide deck features dual-series data visualization in blue and green colors, enabling clear comparison of multiple metrics across categories. The 2-slide template includes infographic elements with percentage indicators for enhanced data storytelling. Delivered in 16:9 widescreen PPTX format, this presentation template is ready for immediate use in business reports, competitive analysis, and performance reviews.
Usage Points
-
Main Usage
This slide specializes in side-by-side comparison of two or more data series across multiple categories. Ideal for market size comparisons, customer segment performance analysis, competitive benchmarking, and multi-metric reporting where simultaneous comparison of related datasets is essential.
-
How to Use
Simply replace the sample data values with your own figures to activate the slide immediately. The blue and green color distinction automatically differentiates the two data series, while the left-side infographic panel can be customized with additional context or supporting statistics.
-
Recommended For
Marketing analysts, sales managers, business intelligence professionals, market researchers, financial analysts, and executives preparing quarterly reports. Effective for presenting quarterly performance comparisons, regional sales metrics, customer satisfaction survey results, and competitive positioning data.
-
Slide Structure
2-slide layout featuring bundled vertical bar charts as the primary visual element. Left panel contains infographic components (human icons with percentage labels) for qualitative context. Right panel accommodates 10–15 data categories with dual-series bars, supporting comprehensive multi-metric analysis and comparison.
Related Products
-

Gender Analysis Chart – Ideal for Market & Customer Analysis
#Market and Competitor Analysis #Financial Plans and Performance #Graph
-

Horizontal Bar Chart Visualizing Market Sales Status
#Market and Competitor Analysis #Financial Plans and Performance #Graph
-

Leather Material Map Template - Global Network Visualization
#Company Introduction #Financial Plans and Performance #Graph
-

Mixed Charts and Customer Analysis – Visualizing Customer Insights
#Market and Competitor Analysis #Financial Plans and Performance #Graph
