Premium Management Presentation Template Map Analysis - Market Analysis and Innovative Strategy
RJ0200031_16
- Last Update 04/06/2025
- File Size 8.4MB
- # of Slides 2
- File Format PPTX
- Slide Ratio 16:9
- Color
Keywords
- #Content-Based Slides
- #Design-Based Slides
- #Market and Competitor Analysis
- #Marketing Plan and Strategy
- #Graph
- #Other
- #Market Analysis
- #Target Setting
- #Column
- #Column Chart
- #Map
- #16:9
- #USA map PowerPoint slide
- #regional data visualization presentation
- #bar chart map slide
- #geographic marker template
- #market analysis map PPT
About the Product
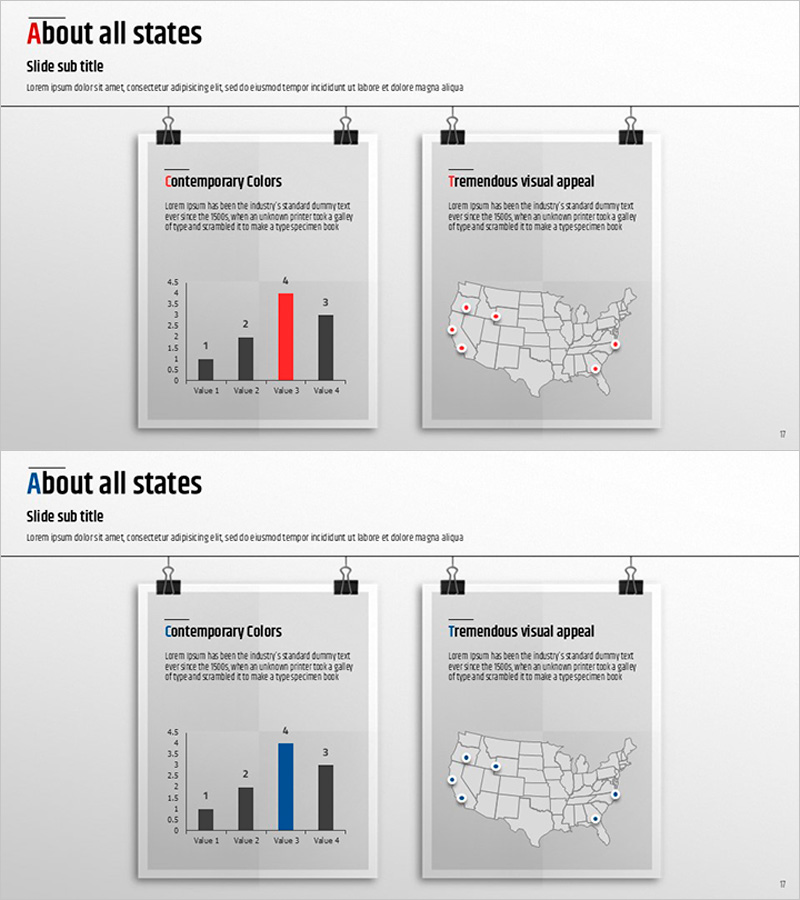
A 2-slide PowerPoint presentation combining a US map with regional markers and comparative bar chart data. The first slide features a vertical bar graph on a gray background displaying four data values with red, black, and gray color coding to highlight key metrics. The second slide presents a US map with four red circular markers positioned across major regions, enabling geographic data representation. This presentation template is ready for immediate use in market analysis, regional strategy presentations, and sales performance reports.
Usage Points
-
Main Usage
Simultaneously display regional market metrics, sales figures, and geographic distribution through integrated map and chart visualization. Ideal for US market expansion strategies, regional performance analysis, and location-based business presentations requiring both spatial and quantitative data representation.
-
How to Use
Input regional data values into the bar chart on slide one, then adjust map marker positions to match actual geographic locations on slide two. Use color emphasis to highlight priority regions and customize titles, legends, and data labels according to presentation context.
-
Recommended For
Marketing managers, sales directors, executives, consulting firms, real estate professionals, retail companies, and financial institutions requiring regional data analysis. Suitable for US market analysis, regional expansion strategy, sales performance reporting, and customer distribution mapping.
-
Slide Structure
Slide 1: Title area + descriptive text + 4-item vertical bar chart (Y-axis 0–4.5, one red-highlighted bar). Slide 2: Title area + descriptive text + US map outline + 4 red circular markers. 16:9 widescreen format, PPTX file, 2-slide set.
Related Products
-

Target Country Analysis Bar Graph – Insights into Global Markets
#Company Introduction #Market and Competitor Analysis #Graph
-

Horizontal Bar Chart Slide for USA Market Analysis
#Market and Competitor Analysis #Graph #Other
-

Global Country Analysis Vertical Bar Graph – Market and Competitor Analysis
#Company Introduction #Market and Competitor Analysis #Graph
-

Global Market Analysis Map – Importance of Market Connectivity
#Company Introduction #Market and Competitor Analysis #Graph
