Activity Time & Calorie Burn Table – Structure for Financial Performance
RB0600006_5
- Last Update 03/14/2025
- File Size 1.1MB
- # of Slides 2
- File Format PPTX
- Slide Ratio 4:3
- Color
Keywords
- #Content-Based Slides
- #Design-Based Slides
- #Financial Plans and Performance
- #Diagram
- #Income Statement
- #Cash Flow Statement
- #Table
- #Standard Table
- #4:3
- #table PowerPoint slide
- #data comparison template
- #4-column table design
- #performance analysis chart
- #activity tracking table
- #PowerPoint table template download
About the Product
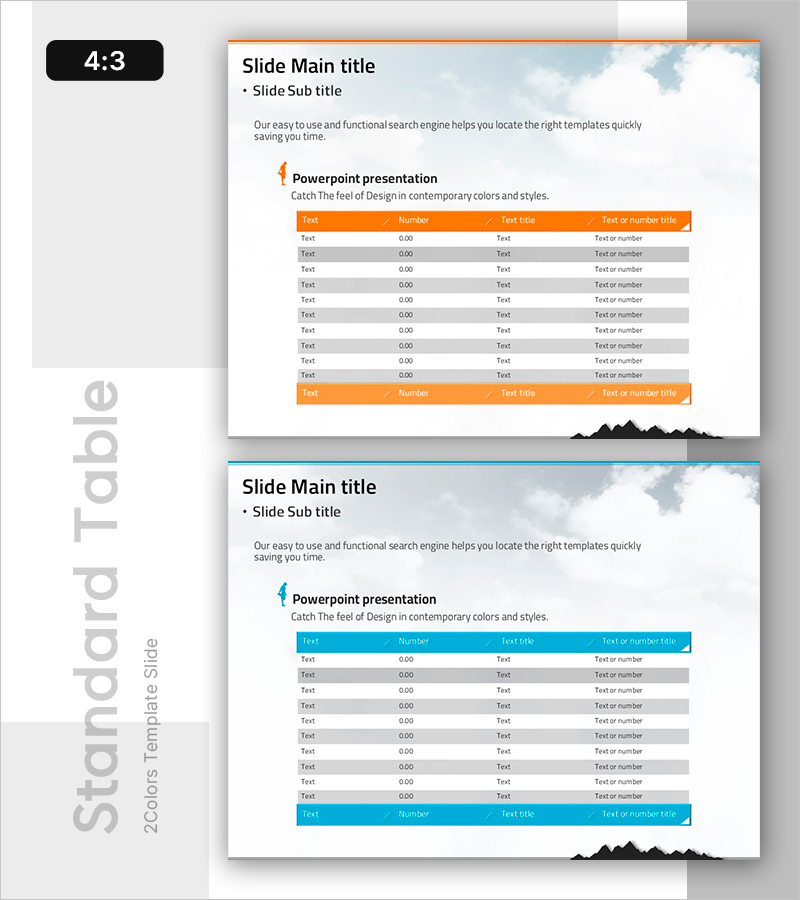
A 4-column table PowerPoint slide designed to organize activity time consumption and calorie burn data. Two design versions with orange and blue headers are provided, each featuring 10 rows for data entry. The horizontal table layout clearly aligns text and numeric items, making it ideal for financial performance reports, activity analysis, and performance presentations. This slide template enables systematic information delivery in your presentation and is ready to use immediately across various business and analytical contexts.
Usage Points
-
Main Usage
Organize quantitative data such as activity time, calorie consumption, and performance metrics in a clear row-and-column structure for presentation slides. Enables quick comparison and analysis of multiple data points at a glance.
-
How to Use
Enter item names in the 'Text' cells and numeric data in the 'Number' cells. Choose between the orange or blue header version that best matches your presentation theme. If you need more rows, simply copy and paste the table row structure to extend the table.
-
Recommended For
Financial performance reports, business analysis presentations, activity status summaries, marketing campaign result analysis, educational seminar materials, and project progress updates. Ideal for professionals requiring data-driven presentations across finance, operations, and management roles.
-
Slide Structure
Horizontal table with 4 columns (Text, Number, Text Title, Text or Number) and 10 data rows. Headers are highlighted in orange or blue for emphasis, while data rows alternate between gray and white backgrounds for improved readability. Two color scheme versions are included.
Related Products
-

Vibrant Paint Splash Table Slide – Financial Performance at a Glance
#Financial Plans and Performance #Diagram #Income Statement
-

Green Blue Standard Table – Visualizing Financial Plans
#Financial Plans and Performance #Diagram #Income Statement
-

Financial Performance Analysis Table Slide – Data Visualization for Growth
#Financial Plans and Performance #Diagram #Income Statement
-

Income Statement Table Slide – Clear Financial Analysis
#Financial Plans and Performance #Diagram #Income Statement
