Green Blue Standard Table – Visualizing Financial Plans
RB0800009_15
- Last Update 03/19/2025
- File Size 3.3MB
- # of Slides 2
- File Format PPTX
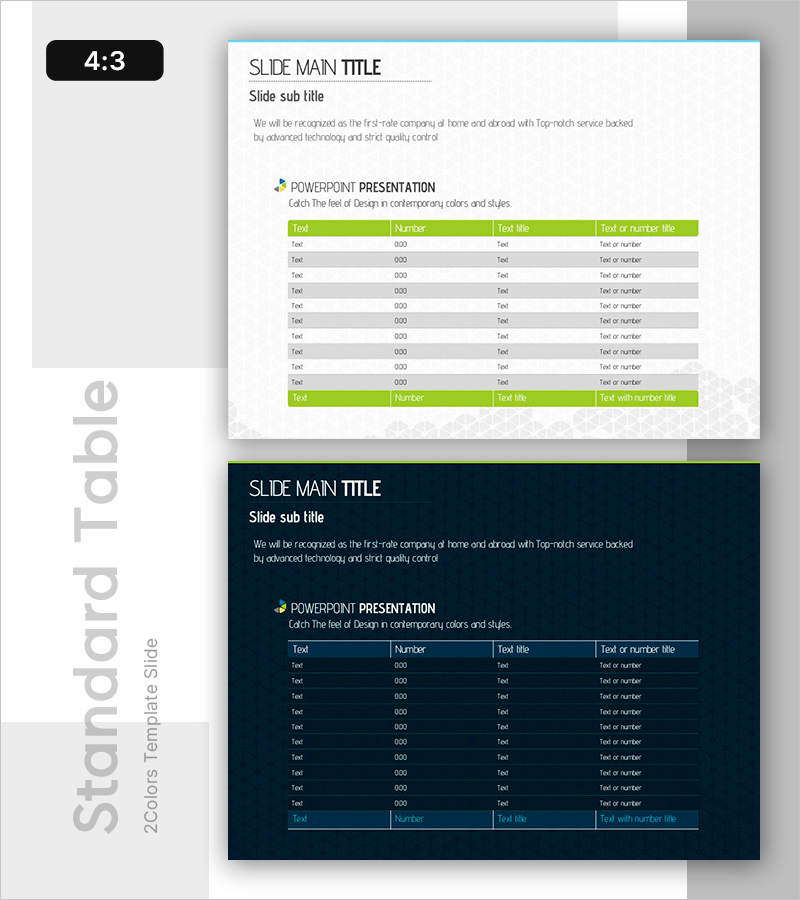
- Slide Ratio 4:3
- Color
Keywords
- #Content-Based Slides
- #Design-Based Slides
- #Financial Plans and Performance
- #Diagram
- #Income Statement
- #Cash Flow Statement
- #Table
- #Standard Table
- #4:3
- #data table PowerPoint slide
- #financial planning presentation
- #spreadsheet template
- #income statement slide
- #table format presentation
- #4-column table PPT
About the Product
A four-column table structure PowerPoint slide designed to clearly organize financial data, income statements, and cash flow information. The bright green header contrasts with the dark blue background to enhance data readability, while row-level gray alternation strengthens information hierarchy. With 2-slide composition, you can represent various financial items flexibly, and the layout is optimized for easy text and numeric input. Ready to use immediately in corporate financial reports, investment presentations, and quarterly earnings announcements.
Usage Points
-
Main Usage
Systematically organize and visualize numerical information such as financial data, sales performance, and cost analysis in table format. The 4-column structure allows simultaneous presentation of item names, figures, descriptions, and additional information, making complex financial data easy to understand at a glance.
-
How to Use
Use in corporate financial reports, quarterly earnings presentations, investor relations meetings, and business plan presentations to display financial figures and performance metrics. Directly edit header text and data cells to customize the slide according to your specific information.
-
Recommended For
CFOs, finance managers, executives, investor relations (IR) specialists, consultants, and business analysts who need to clearly communicate financial status and performance in presentation settings.
-
Slide Structure
2-slide composition with each slide containing 4 columns (item name, figure, description, additional info) and 10 data entry rows. Bright green header row, alternating white and gray data rows, and dark blue background clearly distinguish information hierarchy.
Related Products
-

Vibrant Paint Splash Table Slide – Financial Performance at a Glance
#Financial Plans and Performance #Diagram #Income Statement
-

Activity Time & Calorie Burn Table – Structure for Financial Performance
#Financial Plans and Performance #Diagram #Income Statement
-

Financial Performance Analysis Table Slide – Data Visualization for Growth
#Financial Plans and Performance #Diagram #Income Statement
-

Income Statement Table – Clear Visualization of Financial Performance
#Financial Plans and Performance #Diagram #Income Statement
