Income Statement Table Slide – Clear Financial Analysis
RJ0400067_18
- Last Update 06/05/2025
- File Size 0.1MB
- # of Slides 2
- File Format PPTX
- Slide Ratio 16:9
- Color
Keywords
- #Content-Based Slides
- #Design-Based Slides
- #Financial Plans and Performance
- #Diagram
- #Income Statement
- #Key Financial Indicators
- #Table
- #Standard Table
- #16:9
- #financial data table PowerPoint
- #income statement slide
- #comparison table presentation
- #financial analysis PPT slide
- #data table template download
About the Product
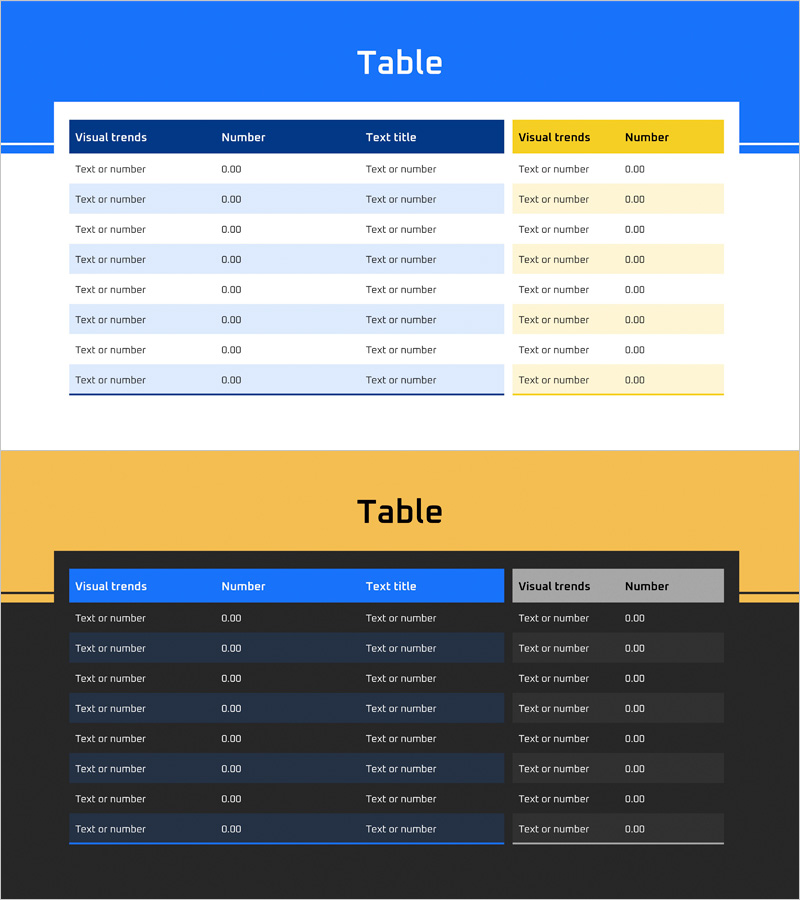
A 2-slide PowerPoint table template for presenting income statements and financial metrics with clarity. Features a dual-table structure with blue header on the left and yellow header on the right, enabling direct comparison of numerical data and line items. Alternating row background colors (light blue and white) enhance readability. Ready to use in financial reports, business plans, investor presentations, and executive briefings.
Usage Points
-
Main Usage
Present financial data, income statements, and key metrics in tabular format to investors, executives, and stakeholders with maximum clarity. The dual-column structure facilitates period-to-period and item-by-item comparison, while color differentiation emphasizes information hierarchy.
-
How to Use
Slide 1 uses the blue header table to input primary financial items (revenue, cost of goods sold, operating income, etc.). Slide 2 uses the yellow header for comparative data. Double-click any cell to edit text or numbers. Add or remove rows and columns as needed to expand the table.
-
Recommended For
Finance teams, CFOs, and executives presenting quarterly or annual financial performance. Ideal for investor presentations, business plan pitches, and financial analysis reports. Suitable for use in banking, securities, and consulting firms.
-
Slide Structure
2-slide layout. Slide 1: Blue header (3 columns) + 8 data rows with alternating background colors. Slide 2: Yellow header (2 columns) + 8 data rows. Both tables use editable text and numeric input cells with header colors and background shading to clearly structure information.
Related Products
-

Leather Material Presentation Template Table Chart – Financial Performance Visualization
#Financial Plans and Performance #Diagram #Income Statement
-

Insight Summary Table – Visualizing Financial Plans and Performance
#Financial Plans and Performance #Diagram #Income Statement
-

Business Income Statement – Visualizing Financial Performance
#Financial Plans and Performance #Diagram #Income Statement
-

Table Chart of Point Frames – Profit and Loss Statement and Key Financial Metrics
#Financial Plans and Performance #Diagram #Income Statement
