Paint Splash Doughnut Chart – Sensuous Visuals
RJ0200040_27
- Last Update 04/09/2025
- File Size 3.7MB
- # of Slides 2
- File Format PPTX
- Slide Ratio 16:9
- Color
Keywords
- #Content-Based Slides
- #Design-Based Slides
- #Business Introduction
- #Financial Plans and Performance
- #Diagram
- #Graph
- #Technological Status
- #Projected Return on Investment (ROI)
- #Table
- #Circles
- #Standard Table
- #Doughnut Chart
- #16:9
- #doughnut chart PowerPoint
- #pie chart slide template
- #ratio comparison PPT
- #data visualization slides
- #PowerPoint graph template
- #how to create doughnut chart in PowerPoint
About the Product
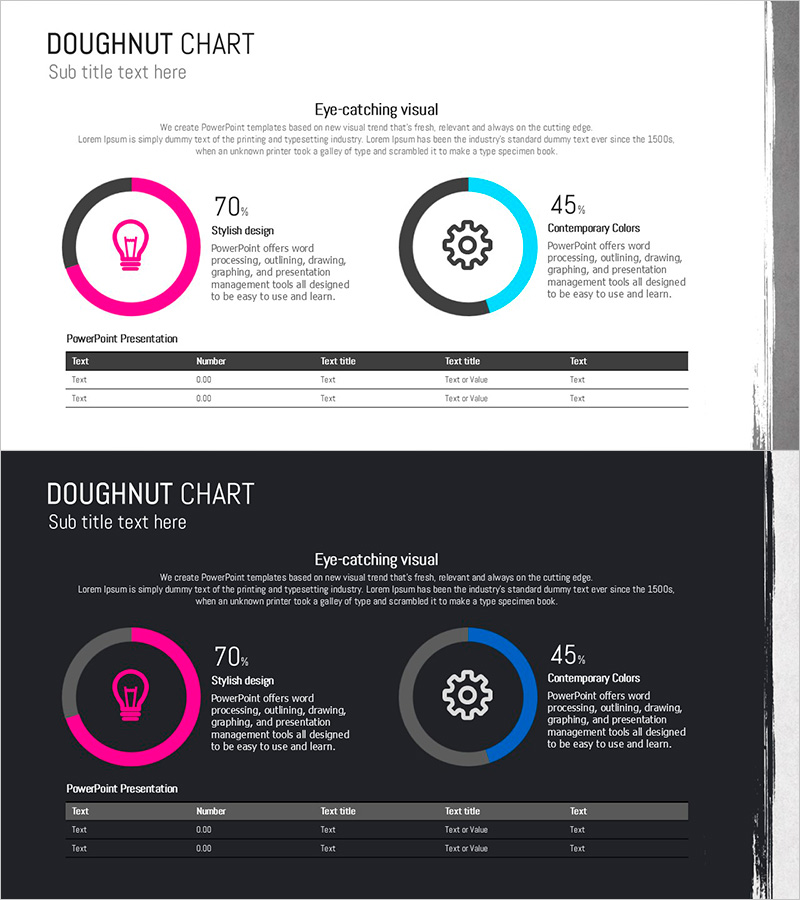
A PowerPoint slide featuring two doughnut charts that visualize ratio comparisons across two data series. The pink and blue color contrast clearly distinguishes each series, with percentage values and icons positioned at the center of each doughnut for enhanced visual clarity. Two background versions—light and dark—are provided to match your presentation tone. Ideal for financial reports, market share analysis, customer segmentation, and any data-driven presentation requiring ratio visualization. Ready to download and customize with your own data.
Usage Points
-
Main Usage
Designed to compare two data series side-by-side using doughnut chart visualization. The hollow center of each doughnut allows for additional text, icons, or key metrics, transforming simple percentage display into meaningful business insights.
-
How to Use
Insert into financial reports (revenue breakdown), marketing presentations (audience demographics), business plans (market share), or investor decks. Simply update the percentage values, and the doughnut sizes adjust automatically. Customize icons and labels to match your presentation context.
-
Recommended For
Finance teams presenting quarterly results, marketing teams analyzing campaign performance, executives preparing board reports, and investment pitch decks. Suitable for any professional requiring ratio-based data visualization in presentations.
-
Slide Structure
Two doughnut charts positioned side-by-side, each with distinct pink and blue coloring. Percentage values and icons (lightbulb and gear) are centered within each doughnut. A data table below provides space for item names and descriptions. Both light and dark background layouts are included for flexibility.
Related Products
-

Doughnut Chart for Financial Performance Visualization – Current Technology Status
#Business Introduction #Financial Plans and Performance #Diagram
-

Orange Yellow Chart Analysis – Utilizing Diagrams and Graphs
#Market and Competitor Analysis #Financial Plans and Performance #Diagram
-

Facility Capacity and Utilization Chart – Emphasizing Operational Efficiency
#Business Introduction #Operational Plan #Diagram
-

Big Data Development Status Analysis Graph – Visualizing Business Strategy
#Product/Service Introduction #Business Introduction #Diagram
