Orange Yellow Chart Analysis – Utilizing Diagrams and Graphs
RJ0600100_22
- Last Update 07/18/2025
- File Size 0.4MB
- # of Slides 2
- File Format PPTX
- Slide Ratio 16:9
- Color
Keywords
- #Content-Based Slides
- #Design-Based Slides
- #Market and Competitor Analysis
- #Financial Plans and Performance
- #Diagram
- #Graph
- #Market Overview
- #Projected Return on Investment (ROI)
- #Table
- #Circles
- #Standard Table
- #Doughnut Chart
- #16:9
- #donut chart PowerPoint slide
- #pie chart template
- #percentage comparison slide
- #data visualization PowerPoint
- #financial analysis chart template
About the Product
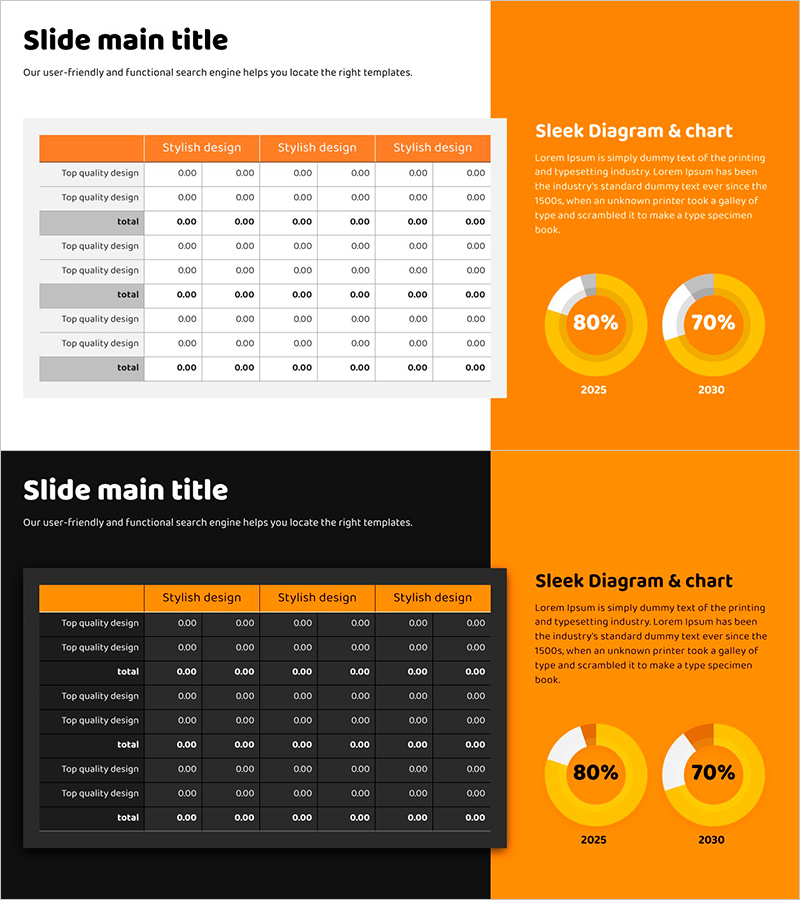
A 2-slide PowerPoint set featuring donut-shaped pie charts in orange and yellow tones. Each slide displays two donut charts side-by-side for intuitive ratio comparison across years, categories, or metrics. The 80% and 70% values are prominently highlighted, making this ideal for presenting performance metrics, market share, financial status, and key performance indicators. Delivered in 16:9 widescreen PPTX format, fully editable with customizable data labels and percentages for any presentation context.
Usage Points
-
Main Usage
Visualize part-to-whole relationships and percentage distributions using donut-shaped charts. The dual-chart layout enables side-by-side comparison of metrics across different time periods, regions, or departments, with prominent numerical emphasis for immediate impact.
-
How to Use
Insert into business performance reports, financial analysis presentations, marketing status updates, and market research findings. Double-click chart elements to edit percentages and labels directly. Adjust segment colors and background tones to match corporate branding guidelines.
-
Recommended For
Finance teams, marketing departments, executive briefings, quarterly and annual performance reviews, market share analysis, customer satisfaction surveys, and departmental KPI presentations. Especially effective when comparing two or more percentage-based metrics simultaneously.
-
Slide Structure
Slide 1: Orange background with 2 donut charts (80%, 70% highlighted) + year labels (2025, 2030) / Slide 2: Black background with identical donut chart layout in white typography. Each chart features an editable center area for value insertion, with individually adjustable segment colors and customizable legend positioning.
Related Products
-

Market Analysis Donut Chart & Table Slide
#Market and Competitor Analysis #Diagram #Graph
-

Industry Trend Analysis Donut Chart – Visual Trends Presentation
#Market and Competitor Analysis #Diagram #Graph
-

Simple Circle Presentation Template Doughnut Chart – Visualizing Financial Performance
#Financial Plans and Performance #Diagram #Graph
-

Detailed Analysis in Book Illustration PowerPoint Template
#Market and Competitor Analysis #Diagram #Graph
