Sensuous Cloud Presentation Template Area Chart – Business Strategy
RJ0200040_25
- Last Update 04/09/2025
- File Size 3.8MB
- # of Slides 2
- File Format PPTX
- Slide Ratio 16:9
- Color
Keywords
- #Content-Based Slides
- #Design-Based Slides
- #Business Strategy
- #Graph
- #Financial Outlook & Expected Impact
- #Achievements
- #Other
- #Area Chart
- #16:9
- #area chart PowerPoint
- #area graph presentation slide
- #trend analysis template
- #stacked area chart
- #business strategy slide
- #light dark theme PowerPoint template
About the Product
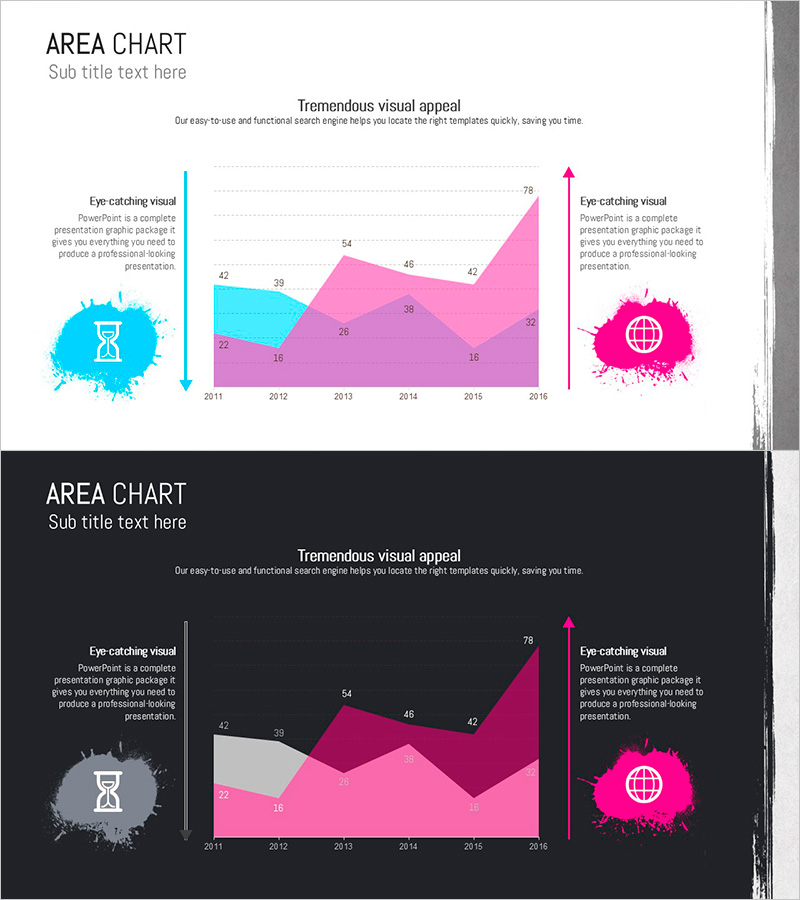
A professional area chart PowerPoint slide designed to visualize business strategy and revenue forecasts. This 2-slide set features both light theme (cyan, magenta, purple) and dark theme (gray, magenta, pink) versions, allowing you to select the best fit for your presentation environment. The chart displays 6-year data trends (2011–2016) using stacked area visualization with paint splash icons and directional arrows to highlight key metrics. Delivered in fully editable PPTX format (16:9 aspect ratio), enabling you to input actual data and integrate the slides directly into your presentation.
Usage Points
-
Main Usage
Communicate multi-year cumulative data trends through stacked area visualization, making business growth trajectories, revenue composition changes, and market share evolution immediately clear. Ideal for executive reports, investor presentations, and business plan pitches where quantitative performance and future outlook must be conveyed with impact.
-
How to Use
Use the light theme for bright conference rooms and online presentations; select the dark theme for large auditoriums and projection environments. Simply input your data into the embedded table, and the chart updates automatically—perfect for quarterly earnings reports, departmental performance comparisons, product line revenue analysis, and real-time data updates during live presentations.
-
Recommended For
CFOs and finance teams presenting operational results, marketing departments analyzing market share, business development teams pitching growth strategies, management consultants preparing client proposals, and startups delivering investor pitch decks. Recommended for any data-driven business presentation requiring quantitative trend visualization.
-
Slide Structure
2-slide composition: Light theme slide (3-series stacked area with cyan, magenta, purple; 6 years of data 2011–2016; left-side icon and right-side emphasis arrow) + Dark theme slide (identical structure with gray, magenta, pink palette). Each slide includes title, subtitle, legend, data labels, and descriptive text boxes for immediate professional use.
Related Products
-

Growth Vertical Bar Graph – Performance and Expectations
#Business Strategy #Graph #Financial Outlook & Expected Impact
-

Introduction Effect Share Graph - Visualizing Business Success
#Business Strategy #Market and Competitor Analysis #Graph
-

Flower and Market Comparison Analysis Chart – Effective Business Strategy
#Business Strategy #Market and Competitor Analysis #Graph
-

Target Performance and Expected Results – Visualized with Vertical Bar Charts
#Business Strategy #Graph #Financial Outlook & Expected Impact
