Growth Vertical Bar Graph – Performance and Expectations
RJ0900026_21
- Last Update 08/23/2025
- File Size 0.5MB
- # of Slides 2
- File Format PPTX
- Slide Ratio 16:9
- Color
Keywords
About the Product
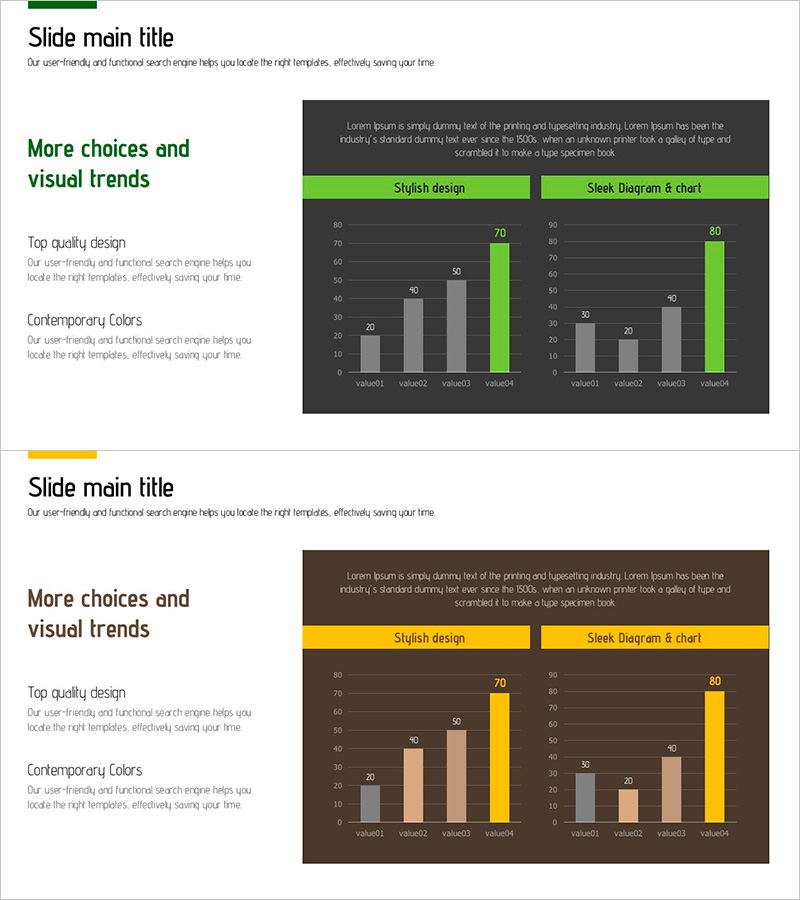
A vertical bar chart PowerPoint slide designed to clearly compare business performance and expected outcomes. The slide features a dark background with gray, beige, and yellow color schemes visualizing four data items to intuitively express growth trends and goal achievement rates. The two-slide set presents the same graph structure in different color combinations, allowing flexible selection based on presentation context. Each slide includes a text area at the top for adding key messages, with easy-to-edit numerical values and color customization. Ideal for immediate use in quantitative data-driven presentations such as business strategy updates, revenue forecasts, and performance analysis.
Usage Points
-
Main Usage
Compares four quantitative data items such as business performance, achievement rates, and revenue forecasts using vertical bar format to clearly visualize growth trends and goal achievement status. Effective for executive reports, investor pitches, and team performance sharing.
-
How to Use
Edit bar heights and numerical values with actual data, and customize colors to match brand identity or presentation theme. Adding analysis results or key messages in the top text area enhances audience comprehension of data context.
-
Recommended For
Recommended for executives, finance professionals, business development teams, marketing managers, and consultants who need to report and persuade with quantitative results. Suitable for quarterly performance reports, annual business plan presentations, investor relations pitches, and strategic meetings.
-
Slide Structure
Both slides follow identical structure with a text description area at the top and vertical bar chart at the bottom. The chart displays four items (value01 through value04). The first slide uses gray and beige tones, while the second slide features yellow accent colors for visual variation.
Related Products
-

Vertical Bar Chart for Achieving Goals – Growth and Fulfillment
#Business Strategy #Graph #Financial Outlook & Expected Impact
-

Flower Wide PPT Vertical Bar Graph – Performance and Expectations
#Business Strategy #Graph #Financial Outlook & Expected Impact
-

Mountain Climbing Goals Market Strategy Vertical Bar Chart
#Business Strategy #Diagram #Graph
-

Travel Competitor Analysis Vertical Bar Graph – Business Strategy
#Business Strategy #Graph #Financial Outlook & Expected Impact
