Growth Highlight Bar Graph – Revenue Outlook and Expectations
RJ0800036_24
- Last Update 08/10/2025
- File Size 0.3MB
- # of Slides 2
- File Format PPTX
- Slide Ratio 16:9
- Color
Keywords
- #Content-Based Slides
- #Design-Based Slides
- #Business Strategy
- #Graph
- #Financial Outlook & Expected Impact
- #Achievements
- #Column
- #Column Chart
- #16:9
- #growth highlight bar chart PowerPoint
- #revenue forecast slide template
- #5-item bar graph
- #performance emphasis chart
- #business strategy presentation slide
About the Product
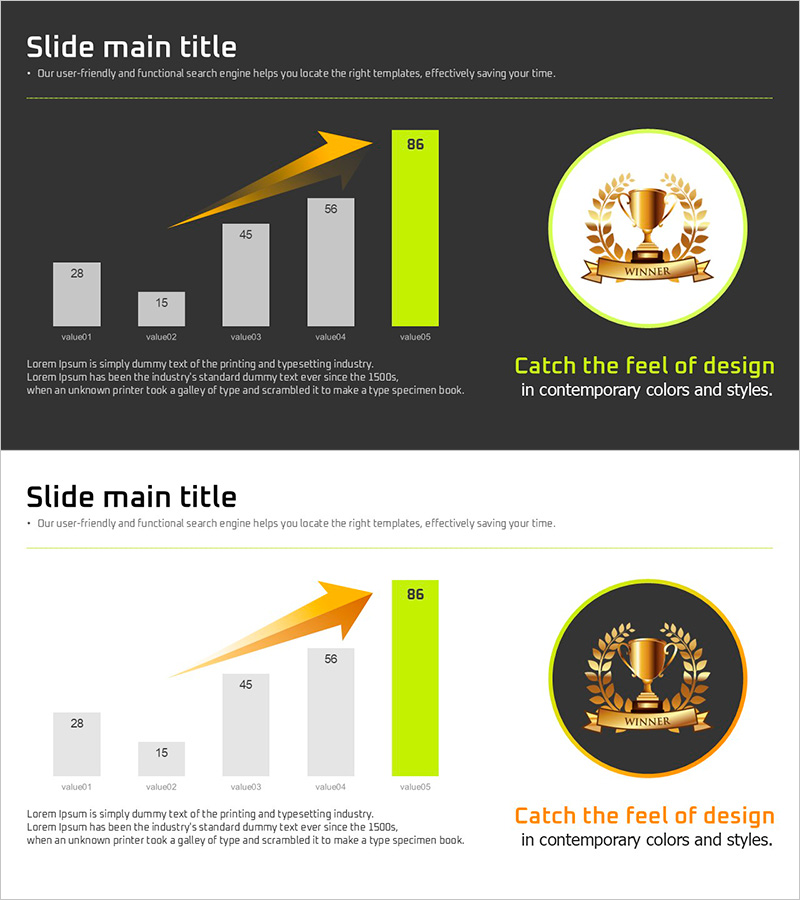
A bar chart PowerPoint slide that visualizes numerical changes across five items with emphasis on peak performance. The final bar is highlighted in lime green to draw attention to the highest value, while a golden arrow emphasizes the upward trend. The dark background combined with bright accent colors ensures excellent data readability. A trophy badge on the right reinforces the message of success and achievement. This slide design is ready to use for business performance reports, revenue forecasts, sales results, and growth-focused presentations.
Usage Points
-
Main Usage
This slide simultaneously displays numerical comparison across five items while emphasizing peak performance. The progressive bar heights and lime highlight effectively communicate growth trends and goal achievement. Ideal for presenting business performance, sales results, revenue forecasts, customer satisfaction metrics, and other upward-trending indicators.
-
How to Use
Update the numerical values in each bar to reflect your data, and adjust the lime highlight position if needed. The dark background provides excellent contrast in projector environments, while the trophy badge reinforces the success message. Suitable for executive reports, investor pitches, quarterly performance reviews, and strategic planning presentations.
-
Recommended For
Recommended for CFOs, finance managers, sales leaders, business planners, and marketing managers who need to report growth metrics. Particularly effective for quarterly earnings presentations, investor relations pitches, business plan development, and performance milestone announcements.
-
Slide Structure
Two-slide set featuring a dark background version and a light background version with identical layouts. Each slide displays a 5-item bar chart (values: 28, 15, 45, 56, 86) with a golden upward arrow and trophy badge positioned on the right. Formatted in 16:9 widescreen ratio for modern presentation environments.
Related Products
-

Flower Wide PPT Vertical Bar Graph – Performance and Expectations
#Business Strategy #Graph #Financial Outlook & Expected Impact
-

Growth Vertical Bar Graph – Performance and Expectations
#Business Strategy #Graph #Financial Outlook & Expected Impact
-

Travel Competitor Analysis Vertical Bar Graph – Business Strategy
#Business Strategy #Graph #Financial Outlook & Expected Impact
-

Mountain Climbing Goals Market Strategy Vertical Bar Chart
#Business Strategy #Diagram #Graph
