Stereographic Area Graph for Data Analysis and Market Outlook
RJ0800006_26
- Last Update 08/01/2025
- File Size 0.4MB
- # of Slides 4
- File Format PPTX
- Slide Ratio 16:9
- Color
Keywords
- #Content-Based Slides
- #Design-Based Slides
- #Business Strategy
- #Market and Competitor Analysis
- #Graph
- #Financial Outlook & Expected Impact
- #Future Outlook
- #Other
- #Area Chart
- #16:9
- #3D area chart PowerPoint
- #stereographic graph slide template
- #data visualization PowerPoint
- #market analysis chart
- #multi-series area graph slide
About the Product
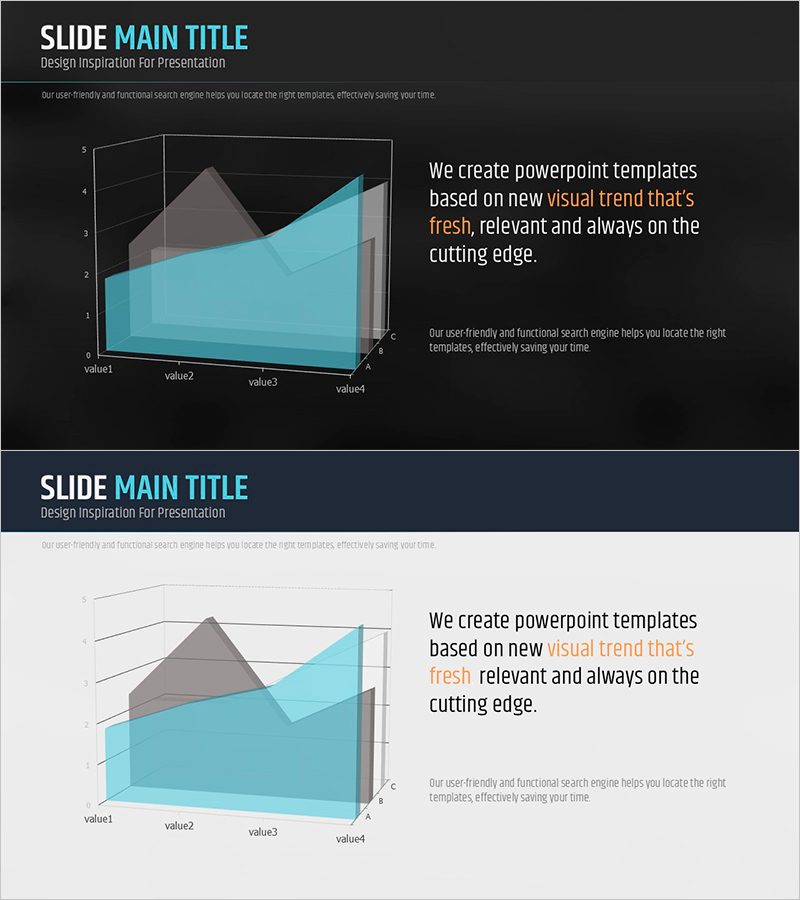
A stereographic area chart PowerPoint slide that visualizes complex multi-series data with intuitive clarity. Dark gray background combined with cyan-to-turquoise gradient areas representing four data series in layered depth, creating strong visual impact through 3D perspective. Four-slide set ready for immediate use in market analysis, business strategy presentations, and financial forecasting. Each slide includes dedicated title and description zones for seamless text customization and professional presentation completion.
Usage Points
-
Main Usage
Visualize trend changes and series comparisons across time using 3D area representation, enhancing audience comprehension. Optimized for time-series data such as market size evolution, revenue trends, and customer segment growth rates.
-
How to Use
Double-click the chart area on each slide to input data or replace existing values. Edit title and description text boxes to match your presentation context, and adjust color palette as needed to align with brand guidelines.
-
Recommended For
Executive and strategy team business planning presentations, marketing team market analysis reports, finance team performance forecasting, consultant client proposals, and any B2B presentation requiring data-driven decision-making.
-
Slide Structure
Four-slide layout. Each slide features a 3D stereographic area chart (4 data series, 5 data points per series) with right-aligned text zone (title and description). Unified design: dark gray background, cyan-to-turquoise gradient areas, gray frame axes, white typography.
Related Products
-

Orange & Green Future Outlook Bar Graph
#Business Strategy #Market and Competitor Analysis #Graph
-

Denim PPT Vertical Bar Graph Analysis – Market and Competitor Analysis
#Business Strategy #Market and Competitor Analysis #Graph
-

Future Outlook and Expected Effects Visualization – Graph Representing Business Strategic Plans
#Business Strategy #Market and Competitor Analysis #Graph
-

Visualizing Profit Outlook with Development and Growth Graphs
#Business Strategy #Market and Competitor Analysis #Graph
