Sensuous Cloud Template for Line Chart Visualization
RJ0200039_8
- Last Update 04/09/2025
- File Size 0.1MB
- # of Slides 2
- File Format PPTX
- Slide Ratio 16:9
- Color
Keywords
- #Content-Based Slides
- #Design-Based Slides
- #Business Strategy
- #Financial Plans and Performance
- #Graph
- #Sales and Revenue
- #Line
- #Line Chart
- #Project Progress
- #16:9
- #line chart PowerPoint
- #multi-series trend analysis slide
- #financial data visualization PowerPoint
- #business performance graph
- #3-series line chart template download
About the Product
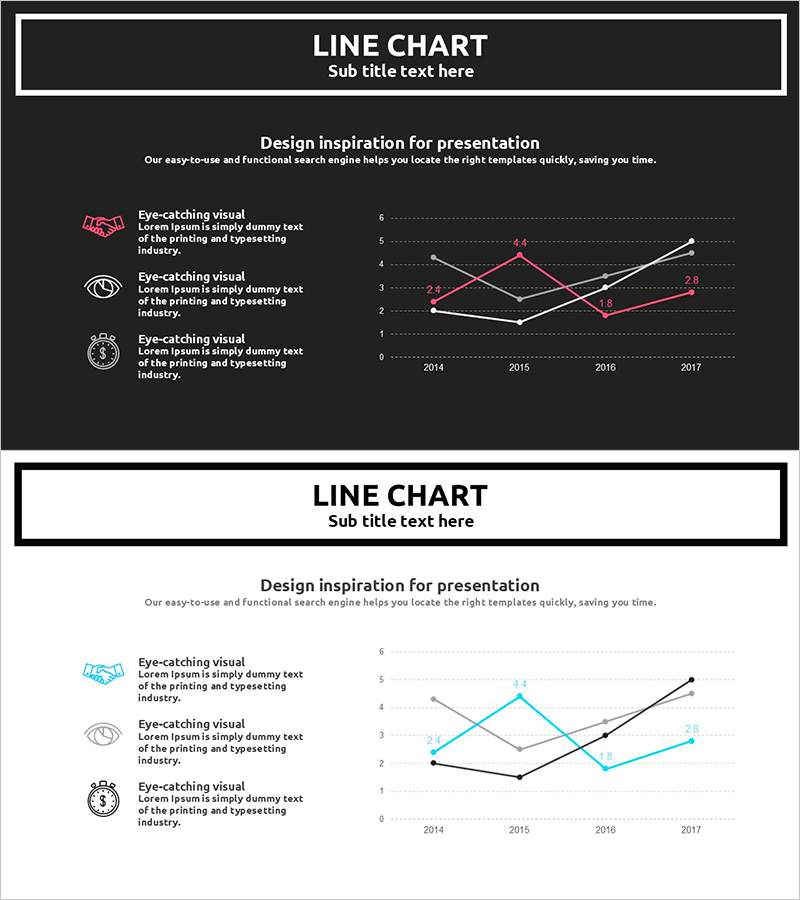
A multi-series line chart PowerPoint slide designed to visualize business progress and financial performance over time. The dark-themed slide features three trend lines in white, red, and cyan, tracking changes from 2014 to 2017 across four years. The left side displays three icons (handshake, eye, clock) with descriptive text to clarify each metric's meaning. Provided in 2-slide format with both dark and light theme versions for immediate use in presentations. This PowerPoint template is optimized for performance analysis sections in business reports, pitch decks, and strategic presentations.
Usage Points
-
Main Usage
Compare multiple performance indicators—such as business progress, financial results, sales trends, and customer satisfaction—across time periods in a single view. Ideal for executive reports, quarterly performance presentations, and investor briefings where key performance indicators (KPIs) must be communicated persuasively.
-
How to Use
Enter each metric's definition (e.g., revenue, profit, customer count) in the left-side icon and text areas, then update the graph's data points with actual figures. Use the dark theme for premium executive reports and the light theme for general presentations. Colors and legend can be customized to match your company's brand guidelines.
-
Recommended For
CFOs, finance managers, business operations leaders, marketing executives, and presentation designers. Suitable for quarterly and annual performance reviews, business plan forecasts, investor relations materials, consulting reports, and academic presentations.
-
Slide Structure
2-slide format. Each slide contains a header area (title and subtitle), a left explanation zone (3 icons with text boxes), and a right graph area (X-axis: 2014–2017, Y-axis: 0–6, 3 trend lines). Both dark theme (black background, white text) and light theme (white background, black text) versions included.
Related Products
-

Real Estate Upside Down Chart – Visualizing Market Trends
#Market and Competitor Analysis #Financial Plans and Performance #Graph
-

Analysis of Successful Revenue Performance Slide – Business Strategy and Financial Results
#Business Strategy #Financial Plans and Performance #Graph
-

Market Trends with Key Focus Areas
#Market and Competitor Analysis #Financial Plans and Performance #Graph
-

Line Chart to Visualize Real Estate Sales Trends – Market Analysis Strategy
#Marketing Plan and Strategy #Financial Plans and Performance #Graph
