Sensuous Cloud Presentation Template for Financial Performance Visualization – Business Insight
RJ0200039_19
- Last Update 04/09/2025
- File Size 0.2MB
- # of Slides 2
- File Format PPTX
- Slide Ratio 16:9
- Color
Keywords
- #Content-Based Slides
- #Design-Based Slides
- #Financial Plans and Performance
- #Graph
- #Income Statement
- #Sales and Revenue
- #Column
- #Grouped Column
- #16:9
- #grouped column chart PowerPoint
- #multi-series bar chart slide
- #financial data visualization PPT
- #comparison chart presentation
- #how to create grouped chart in PowerPoint
About the Product
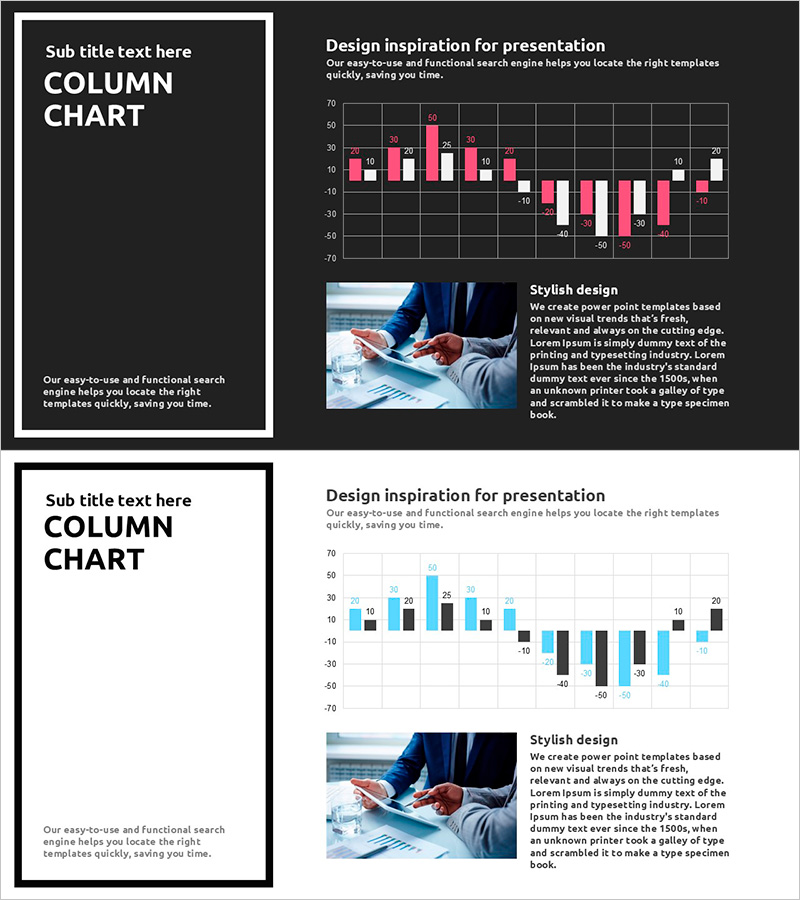
A grouped column chart PowerPoint slide designed for comparing financial performance and business metrics at a glance. The dark background version features pink, white, and black data series for intuitive numerical comparison and trend analysis. The 2-slide set includes a light background version, allowing you to match your presentation tone and document style. Ideal for financial reports, performance analysis, marketing data visualization, and various business presentations that require immediate implementation.
Usage Points
-
Main Usage
Compare multiple data series simultaneously, such as financial results, sales figures, and departmental performance. Two background options—dark and light—allow flexible adjustment of presentation tone and report styling.
-
How to Use
Double-click the data values on the slide to edit directly; the chart updates automatically. Color schemes can be customized to match corporate branding, and legend and axis labels are fully editable.
-
Recommended For
Finance teams presenting quarterly and annual results, marketing teams analyzing channel performance, and sales teams reporting regional or product-based sales figures. Also suitable for executive briefings and shareholder disclosure materials.
-
Slide Structure
2-slide set with dark background (black and gray) featuring 3-series pink, white, and black data in slide 1, and light background (white) with identical chart structure in slide 2. Each slide includes title area, chart area, and descriptive text area.
Related Products
-

Internet Shopping Sales and Profit Calculation Chart – Your Business Success Guide
#Financial Plans and Performance #Diagram #Graph
-

Orange Green Profit and Loss Chart – Visualizing Revenue and Profit
#Financial Plans and Performance #Diagram #Graph
-

Business Sales and Profit Statement Slide – Realizing Financial Plans
#Financial Plans and Performance #Diagram #Income Statement
-

Successful Sales and Profit Table
#Financial Plans and Performance #Diagram #Income Statement
