Arctic Business Goals Market Strategy Chart
RJ0600040_14
- Last Update 07/01/2025
- File Size 0.3MB
- # of Slides 2
- File Format PPTX
- Slide Ratio 16:9
- Color
Keywords
- #Content-Based Slides
- #Design-Based Slides
- #Market and Competitor Analysis
- #Financial Plans and Performance
- #Diagram
- #Graph
- #Competitive Advantage
- #Capital Requirements
- #Table
- #Circles
- #Standard Table
- #Doughnut Chart
- #16:9
- #doughnut chart PowerPoint
- #pie chart slide template
- #data visualization presentation
- #business goals chart
- #3-series comparison graph
- #donut chart download
About the Product
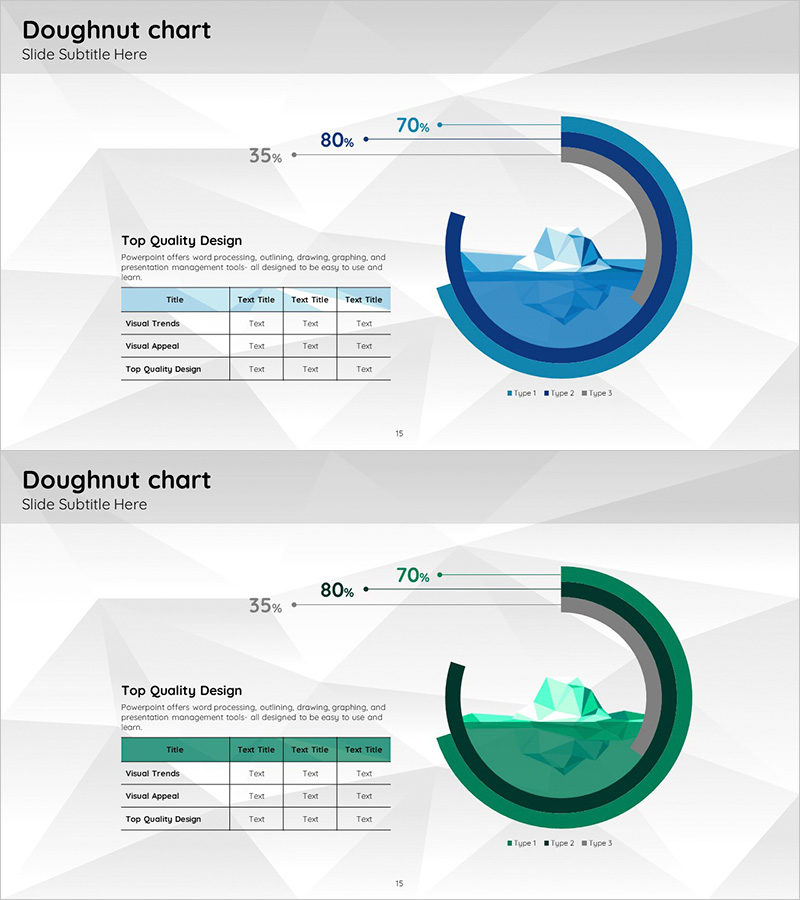
A professional doughnut chart PowerPoint slide set designed to visualize business goals and market strategy data. This 2-slide template features both blue and green color versions, each capable of displaying three data series simultaneously. The design incorporates a mountain illustration in the center to symbolize business growth and goal achievement. A data table on the left side allows for detailed information input, while arrow connectors link the chart to specific metrics, creating a clear information flow. The slides are ready to use in business presentations, strategic plans, marketing proposals, and financial reports without additional design work.
Usage Points
-
Main Usage
Display three data series simultaneously using the doughnut chart format, ideal for showing business goal achievement rates, market share percentages, or financial ratios. The central mountain illustration and arrow connectors emphasize data meaning and improve audience comprehension. Choose between blue and green color schemes to match your corporate branding and presentation theme.
-
How to Use
Enter item names and numerical values into the left-side data table, and the doughnut chart updates automatically. Edit the percentage values on the arrow connectors to match your actual data, and add a legend to clearly distinguish each data series. Customize colors and fonts freely according to your corporate brand guidelines.
-
Recommended For
Ideal for business plan goal-setting sections, marketing proposal market analysis pages, investor pitch deck financial overview slides, and quarterly business performance reports. Suitable for executive briefings, employee training sessions, client presentations, and various corporate communication scenarios.
-
Slide Structure
Each slide features a left information panel (title, description, 4-row data table) and a right doughnut chart area. The doughnut chart displays 3 data series with arrow connectors showing percentage values (35%, 80%, 70%). A mountain illustration in the center enhances visual completeness and reinforces the growth narrative.
Related Products
-

Type Comparison Analysis Graph & Table – Effective Tool for Market Analysis
#Market and Competitor Analysis #Diagram #Graph
-

Current Status Dominance Analysis Chart – Visualizing Competitive Advantage
#Company Introduction #Market and Competitor Analysis #Diagram
-

Sensuous Doughnut Chart Slide – Market Share Analysis
#Market and Competitor Analysis #Diagram #Graph
-

Key Competitive Factors in Market Analysis – First Step Toward Competitive Advantage
#Market and Competitor Analysis #Diagram #Graph
