Fashion Design Comparative Donut Chart – Market Share Analysis
RJ0500019_9
- Last Update 08/27/2025
- File Size 1.7MB
- # of Slides 2
- File Format PPTX
- Slide Ratio 16:9
- Color
Keywords
- #Content-Based Slides
- #Design-Based Slides
- #Market and Competitor Analysis
- #Graph
- #Market Share
- #Competitive Advantage
- #Circles
- #Doughnut Chart
- #16:9
- #donut chart PowerPoint
- #pie chart template
- #comparative analysis slide
- #market share visualization
- #2-segment donut template
- #circular graph presentation
- #PowerPoint chart design
About the Product
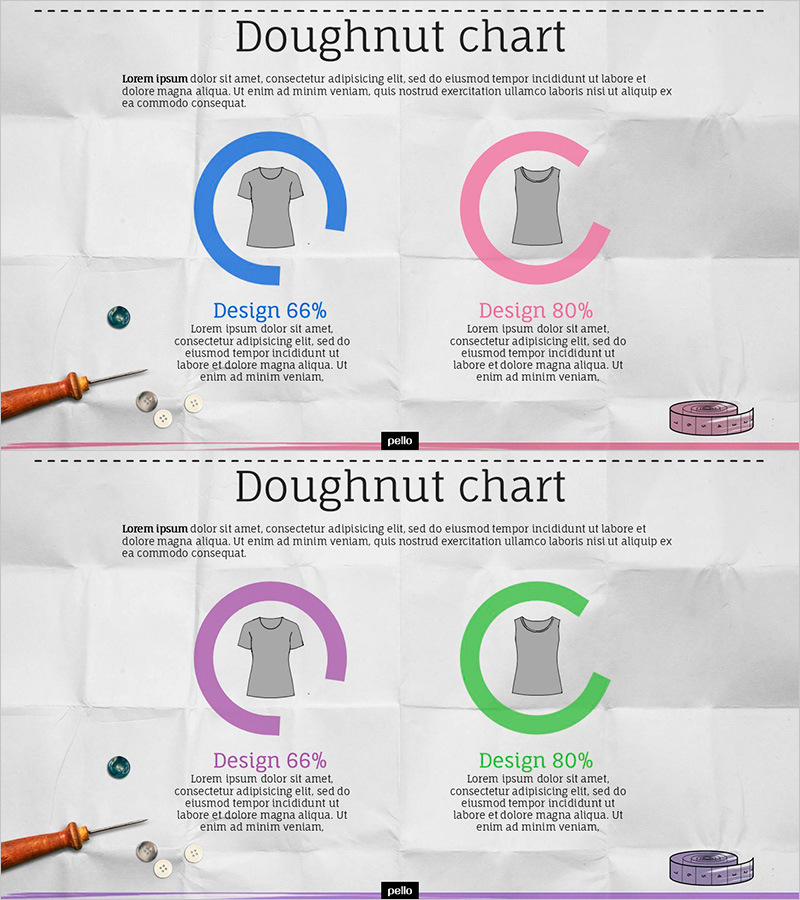
A 2-slide donut chart PowerPoint template designed for fashion industry market share and competitive analysis presentations. Features two circular graphs with blue and pink color segments displaying 66% and 80% data values, each with descriptive text areas below. The PPTX format (16:9 widescreen) is fully editable and ready to use. The donut center includes an icon placeholder for brand logos or product images, making it ideal for market comparison, category composition analysis, and competitive positioning slides. Perfect for business presentations requiring visual data representation with professional styling.
Usage Points
-
Main Usage
Visualize market share, competitive positioning, and category composition using two-segment donut charts. The center icon area accommodates brand logos or product images for enhanced visual impact and brand recognition in business presentations.
-
How to Use
Replace the 66% and 80% values with your actual data and update the descriptive text below each donut. Customize the blue and pink colors to match your corporate branding, and insert your logo or product image in the center icon area for professional presentation results.
-
Recommended For
Marketing professionals, business strategists, and executives presenting market analysis, fashion brand leadership reports, product category sales performance, investor pitch decks, and competitive landscape presentations.
-
Slide Structure
2-slide layout: title section + 2 donut charts (blue 66%, pink 80%) + text description boxes below each chart + center icon insertion area. Optimized for 16:9 widescreen display and large-screen presentations.
Related Products
-

Sharing vs Housing Insights Chart – Market Share and Competitive Advantage
#Market and Competitor Analysis #Graph #Market Share
-

Market Share and Competitive Advantage via Bar and Donut Charts – Product Satisfaction Survey
#Market and Competitor Analysis #Graph #Market Share
-

Travel Agency Market Share and Trends – Data Slide for Competitive Advantage
#Market and Competitor Analysis #Diagram #Graph
-

Speed Timer Diagram for Market Share Analysis
#Market and Competitor Analysis #Diagram #Graph
