Four Color Infographic Bar Chart Template – Visualize Your Competitive Advantage
RJ0200037_9
- Last Update 04/08/2025
- File Size 0.2MB
- # of Slides 2
- File Format PPTX
- Slide Ratio 16:9
- Color
Keywords
- #Content-Based Slides
- #Design-Based Slides
- #Market and Competitor Analysis
- #Graph
- #Competitor Analysis
- #Competitive Advantage
- #Column
- #Grouped Column
- #16:9
- #grouped bar chart PowerPoint
- #data comparison slides
- #4-color infographic chart
- #market analysis graph template
- #competitive analysis PowerPoint slide
About the Product
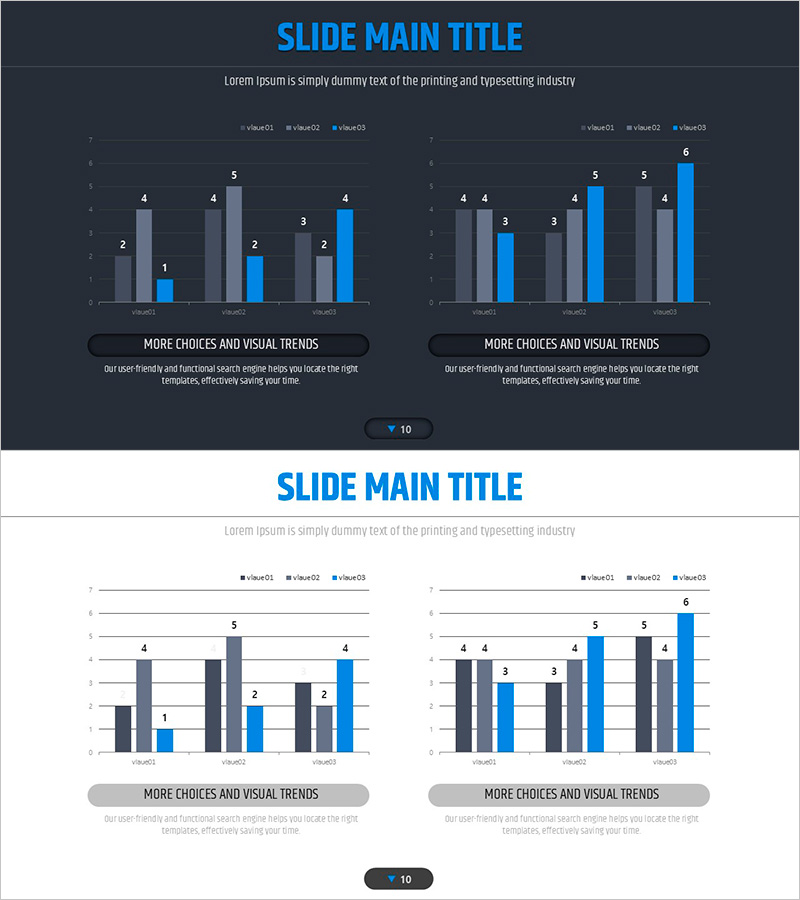
A grouped bar chart PowerPoint slide optimized for market analysis and competitive comparison with four-color infographic design. The dark background features blue, gray, and black bar series arranged in groups of three, enabling intuitive comparison of multiple data sets. The 2-slide set includes both left and right layout options to match your presentation flow. Each item displays clear numerical labels for data accuracy, with description areas at the bottom for adding insights. Provided in fully editable PPTX format for immediate customization.
Usage Points
-
Main Usage
A grouped bar chart that compares multiple data series side-by-side, visualizing 3-4 items such as market size, competitor performance, or product specifications simultaneously. Color-coded series enhance data interpretation, while numerical labels ensure precise value communication.
-
How to Use
Insert into business plans, marketing proposals, or quarterly reports in market analysis or competitive analysis sections. Choose between two layout options based on your presentation flow, then replace legend labels, item names, and values with your own data.
-
Recommended For
Marketing professionals, strategy planners, and sales executives use this to convincingly present competitive advantages, market share, and product performance comparisons. Ideal for investor pitch decks, client proposals, and internal executive presentations to strengthen data credibility.
-
Slide Structure
2-slide set with grouped bar charts featuring 3 series × 3-4 items per slide. Dark background with blue, gray, and black bars in clear contrast. Title area at top and description zone at bottom allow for context and insights to be added.
Related Products
-

Bar Chart Visualizing Freight Transport Trends – Essential Market Analysis Tool
#Market and Competitor Analysis #Graph #Text Box
-

Vertical Bar Chart for Data Analysis Visualization – Efficiency and Practicality
#Market and Competitor Analysis #Graph #Competitor Analysis
-

Sales Status Table and Analysis – Clustered Column Charts for Competitor Analysis
#Market and Competitor Analysis #Graph #Text Box
-

Business Analysis Chart – Visualizing Competitive Advantage
#Market and Competitor Analysis #Graph #Other
