Bar Chart Visualizing Freight Transport Trends – Essential Market Analysis Tool
RJ0800029_9
- Last Update 08/08/2025
- File Size 0.4MB
- # of Slides 2
- File Format PPTX
- Slide Ratio 16:9
- Color
Keywords
- #Content-Based Slides
- #Design-Based Slides
- #Market and Competitor Analysis
- #Graph
- #Text Box
- #Competitor Analysis
- #Competitive Advantage
- #Column
- #Grouped Column
- #Sticky Note
- #16:9
- #horizontal bar chart PowerPoint
- #bar graph slide template
- #market analysis chart
- #data comparison PowerPoint
- #freight transport statistics slide
About the Product
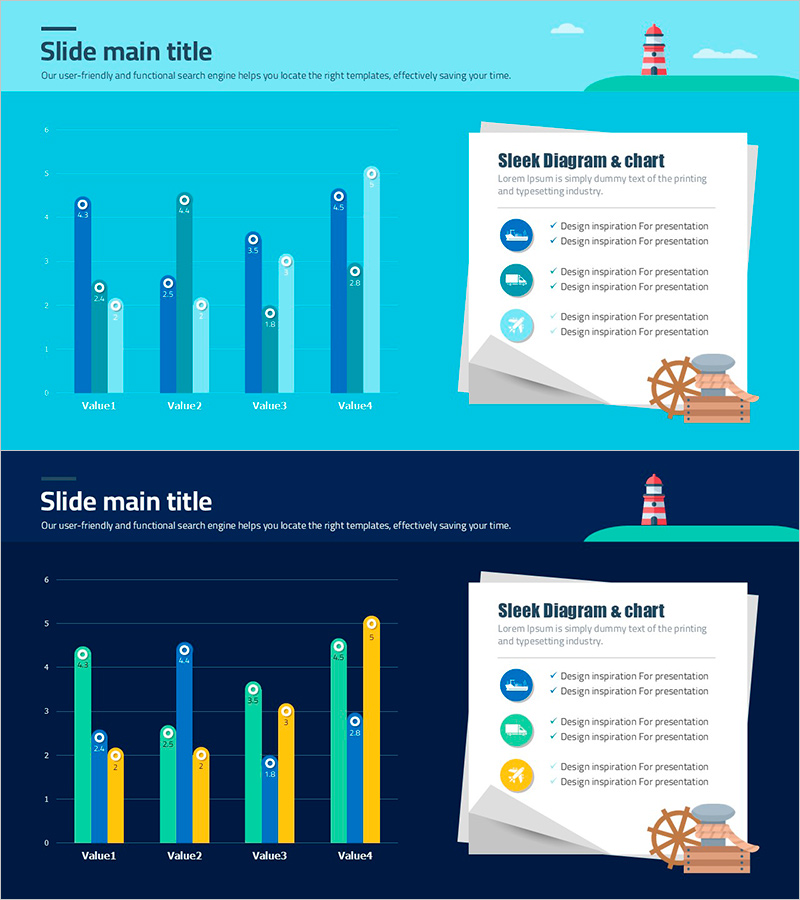
A horizontal bar chart PowerPoint slide that visualizes freight transport trends and competitive market positioning. This presentation template features a two-series data comparison across four items using light blue and dark blue color schemes, with numerical labels displayed on each bar for precise value communication. The 16:9 widescreen format includes two slide layouts—one with a light background and one with a dark background—enabling flexible use in various presentation contexts. Designed for immediate integration into business reports and presentations, this slide template is optimized for executive briefings, investor presentations, and market analysis discussions requiring data-driven decision-making.
Usage Points
-
Main Usage
Clearly visualizes quantitative data such as freight transport market size, competitor benchmarking, and growth trends to support data-driven decision-making in executive briefings, investor relations presentations, and market analysis discussions.
-
How to Use
Easily customize the bar lengths and numerical values to match your dataset for immediate use. The light background version suits daytime presentations, while the dark background version works well for evening events or sophisticated presentation settings. Colors and fonts can be edited to align with your corporate brand guidelines.
-
Recommended For
Recommended for logistics and transportation company executives, market analysts, business consultants, investment professionals, and marketing strategists who require quantitative data-based presentations. Particularly valuable for industry reports, quarterly earnings presentations, and competitive analysis materials.
-
Slide Structure
Consists of two slides, each displaying a clustered horizontal bar chart with four items (Value1–Value4) and two data series (light blue and dark blue bars) positioned side by side. Numerical labels appear at the end of each bar for precise value comparison, with item names clearly labeled at the bottom of the chart.
Related Products
-

Market Trend Visualized with Vertical Bar Graph
#Market and Competitor Analysis #Graph #Competitor Analysis
-

Past Present Comparative Analysis Bar Graph – Emphasizing Market Competitive Advantage
#Market and Competitor Analysis #Graph #Competitor Analysis
-

Blue Orange Competitive Analysis Bar Graph
#Market and Competitor Analysis #Graph #Competitor Analysis
-

Business Analysis Chart – Visualizing Competitive Advantage
#Market and Competitor Analysis #Graph #Other
