Four Color Infographic – Business Status Presentation
RJ0200037_22
- Last Update 04/08/2025
- File Size 0.2MB
- # of Slides 2
- File Format PPTX
- Slide Ratio 16:9
- Color
Keywords
- #Content-Based Slides
- #Design-Based Slides
- #Product/Service Introduction
- #Business Introduction
- #Graph
- #Development Status
- #Technological Status
- #Circles
- #Doughnut Chart
- #16:9
- #donut chart PowerPoint
- #pie chart slide template
- #business status infographic
- #four-color chart slide
- #ratio visualization PowerPoint
About the Product
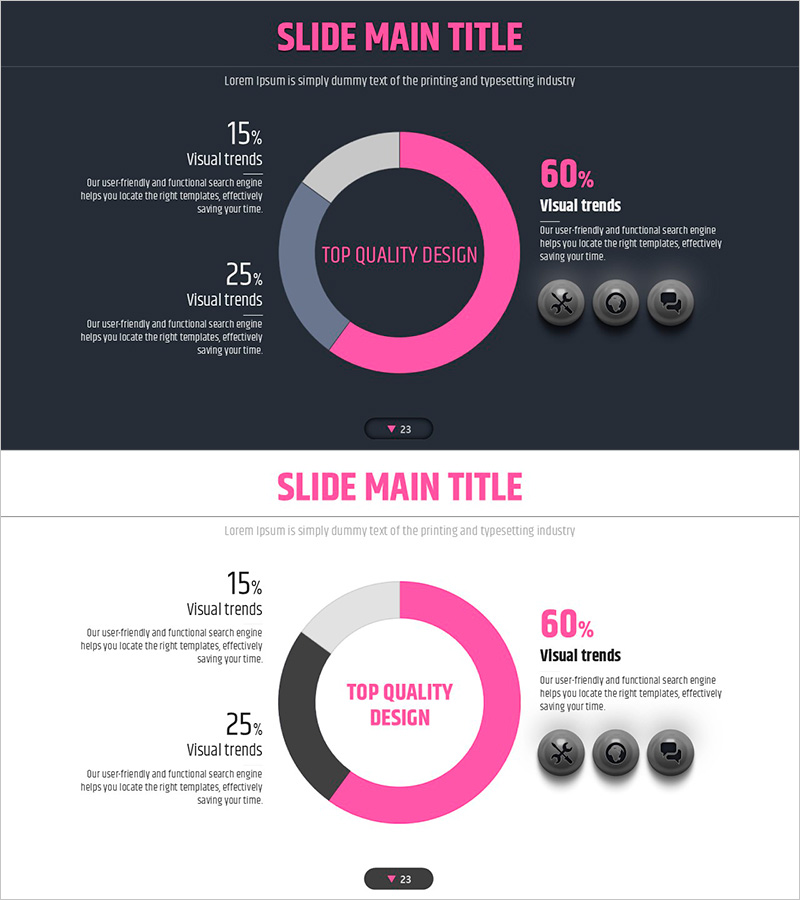
A donut chart PowerPoint slide that visualizes business status using four distinct colors: pink, gray, black, and light gray. Each segment clearly represents the proportion of different business components, with a central area for key messaging. This 2-slide set includes both dark and white background versions, allowing you to choose the appropriate design for your presentation context. Ideal for product introductions, service breakdowns, business analysis, and performance reports where data proportions need clear visual communication.
Usage Points
-
Main Usage
Display proportions and composition of business status, product offerings, or service analysis using a four-segment donut chart. The central area accommodates key messages, statistics, or titles to draw audience focus and enhance data comprehension.
-
How to Use
Click each colored segment to input proportion values and percentages. Add your headline or key statistic in the center text box. Use the dark background version for professional corporate presentations and the white background version for friendly, approachable communication styles.
-
Recommended For
Executive reports, investment pitch decks, sales presentations, market share analysis, customer segmentation, product portfolio reviews, and business performance briefings where proportion-based data visualization is essential.
-
Slide Structure
Donut-shaped pie chart with four color-coded segments (pink 60%, gray 25%, black 15%, light gray segments), central text input area, three explanation text boxes positioned at upper left and right, and three functional icons at the bottom.
Related Products
-

Business Development Status Donut Graph – A Template for Visual Communication
#Product/Service Introduction #Business Introduction #Diagram
-

Visualizing Business Development Status with Donut Chart Slide
#Product/Service Introduction #Business Introduction #Graph
-

Visualizing Military Data with Donut Chart – Power of Trust
#Product/Service Introduction #Business Introduction #Diagram
-

Financial Management Analysis Status Graph
#Product/Service Introduction #Business Introduction #Graph
