Business Plan Presentation Template Pie Diagram – Effective Project Introduction
RJ0200027_6
- Last Update 04/05/2025
- File Size 1.5MB
- # of Slides 2
- File Format PPTX
- Slide Ratio 16:9
- Color
Keywords
- #Content-Based Slides
- #Design-Based Slides
- #Product/Service Introduction
- #Business Introduction
- #Graph
- #Development Status
- #Technological Status
- #Circles
- #Doughnut Chart
- #16:9
- #donut chart PowerPoint slide
- #pie chart presentation template
- #ratio visualization PPT
- #circular chart slide
- #data visualization PowerPoint
About the Product
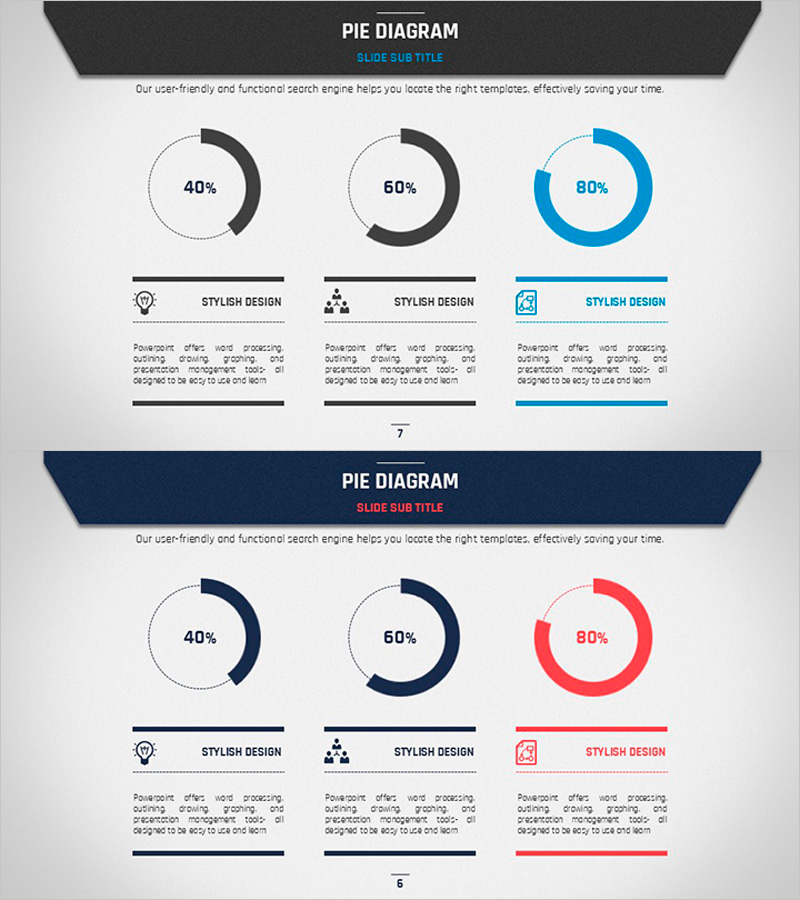
A donut chart PowerPoint slide optimized for business plan presentations. This 2-slide template displays 40%, 60%, and 80% ratios in three color variations: charcoal, navy, and bright blue. Each chart includes an icon and text area below for adding item descriptions. Delivered in 16:9 widescreen PPTX format, fully editable and ready to use. Perfect for visualizing business performance, market share, goal achievement, and other data-driven metrics. Ideal for presentation decks, reports, and planning documents across various business contexts.
Usage Points
-
Main Usage
Communicate numerical ratios, composition, and performance metrics in business plans, reports, and marketing presentations. The donut chart's center space allows emphasis of key figures or titles, increasing audience engagement.
-
How to Use
Replace chart percentages with your actual data, add item names and descriptions in the text areas below each icon. Colors are fully customizable to match your brand guidelines. Optimized for 16:9 widescreen display.
-
Recommended For
Business managers, marketing teams, and executives presenting performance reports. Ideal for conveying ratio-based information such as market share, goal achievement rates, budget allocation, and customer demographics.
-
Slide Structure
Two-slide layout. Each slide contains three donut charts (40%, 60%, 80% ratios) with icons and text fields below. Header area at top for title and subtitle. All elements are editable and repositionable.
Related Products
-

Business Analysis with Doughnut Chart – Dawn City Theme
#Product/Service Introduction #Business Introduction #Diagram
-

Exercise Objectives Achieved Diagram & Chart – Post-Progress
#Product/Service Introduction #Business Introduction #Diagram
-

Financial Management Analysis Status Graph
#Product/Service Introduction #Business Introduction #Graph
-

Space Industry Development Status Graph – Capturing the Future of Industry
#Product/Service Introduction #Business Introduction #Graph
