Prepare for Market Analysis with Four Color Infographic Template
RJ0200037_14
- Last Update 04/08/2025
- File Size 0.2MB
- # of Slides 2
- File Format PPTX
- Slide Ratio 16:9
- Color
Keywords
- #Content-Based Slides
- #Design-Based Slides
- #Market and Competitor Analysis
- #Financial Plans and Performance
- #Graph
- #Market Analysis
- #Sales and Revenue
- #Horizontal Bar
- #Grouped Horizontal Bar
- #16:9
- #horizontal bar chart PowerPoint
- #market analysis presentation slide
- #data comparison chart
- #bar graph template
- #business presentation slide download
About the Product
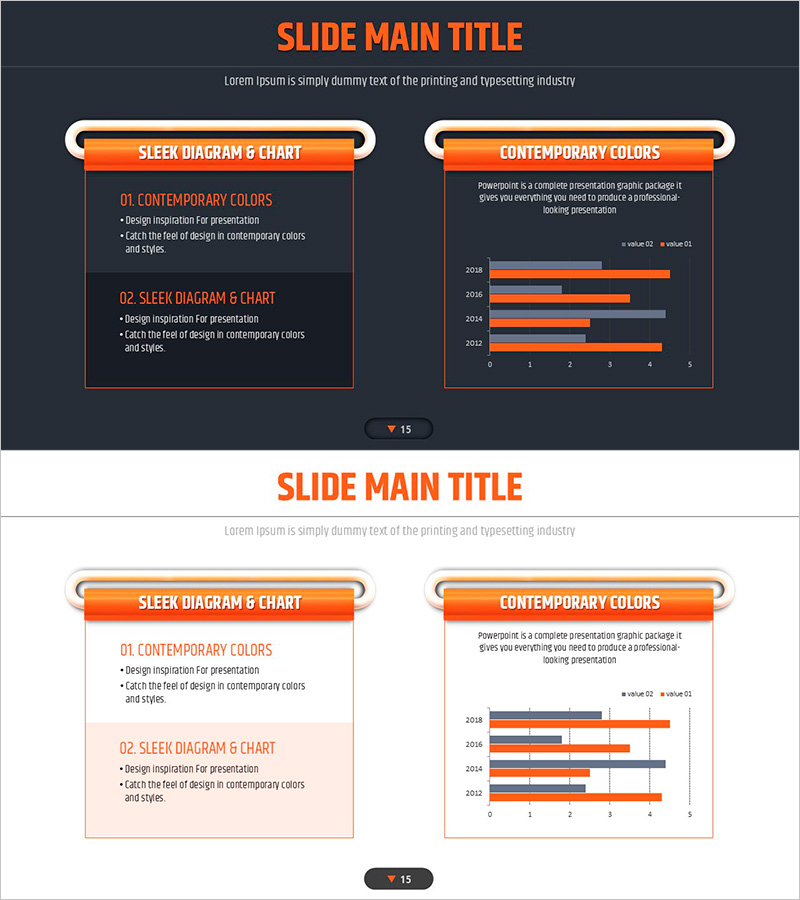
A 2-slide PowerPoint presentation optimized for market analysis and data comparison presentations. The horizontal bar chart features an orange and gray dual-tone color scheme, enabling side-by-side comparison of 4 years of data across 2 data series. The first slide uses a contemporary text box layout to highlight key insights, while the second slide presents actual numerical data through a horizontal bar graph visualization. In 16:9 widescreen PPTX format, fully editable and ready for immediate use in corporate presentations, marketing plans, business reports, and strategic briefings.
Usage Points
-
Main Usage
Visualize quantitative data such as market size, competitor benchmarking, year-over-year growth rates, and category market share through horizontal bar graphs to enhance audience comprehension. Simultaneous display of 2 data series facilitates comparative analysis and strengthens credibility for business decision-making materials.
-
How to Use
On the first slide, organize your analysis topic and key messages using the text box sections. On the second slide, input actual numerical values into the horizontal bar chart. Adjust the orange highlight bars and gray comparison bars to reflect your data, then modify the legend and axis labels to match your presentation context.
-
Recommended For
Marketing professionals presenting market analysis, sales teams reporting competitive comparisons, executive quarterly performance reviews, consulting firms preparing client proposals, academic presentations, and research findings dissemination.
-
Slide Structure
Slide 1: Main title + 2 content sections with text boxes (3+ bullet points each) / Slide 2: Title + descriptive text + 4-row × 2-series horizontal bar chart (2015-2018 data with 2-item legend)
Related Products
-

Navigation Guidance Map & Car System Analysis Graph – Market Competition Analysis
#Market and Competitor Analysis #Graph #Competitor Analysis
-

Visual Comparison by Product Group Slide Template – Market Trends and Performance
#Market and Competitor Analysis #Financial Plans and Performance #Graph
-

Market Analysis Graph by Year – Visualizing Competitive Advantage
#Market and Competitor Analysis #Graph #Market Analysis
-

Table Slide for Garden Industry Status Analysis
#Market and Competitor Analysis #Financial Plans and Performance #Diagram
