Navigation Guidance Map & Car System Analysis Graph – Market Competition Analysis
RJ0400042_14
- Last Update 08/30/2025
- File Size 0.4MB
- # of Slides 2
- File Format PPTX
- Slide Ratio 16:9
- Color
Keywords
- #Content-Based Slides
- #Design-Based Slides
- #Market and Competitor Analysis
- #Graph
- #Competitor Analysis
- #Market Analysis
- #Horizontal Bar
- #Grouped Horizontal Bar
- #16:9
- #world map PowerPoint slide
- #horizontal bar chart template
- #map and chart design
- #market analysis graph
- #data comparison slide
- #competitive analysis PPT
- #how to create map and chart in PowerPoint
About the Product
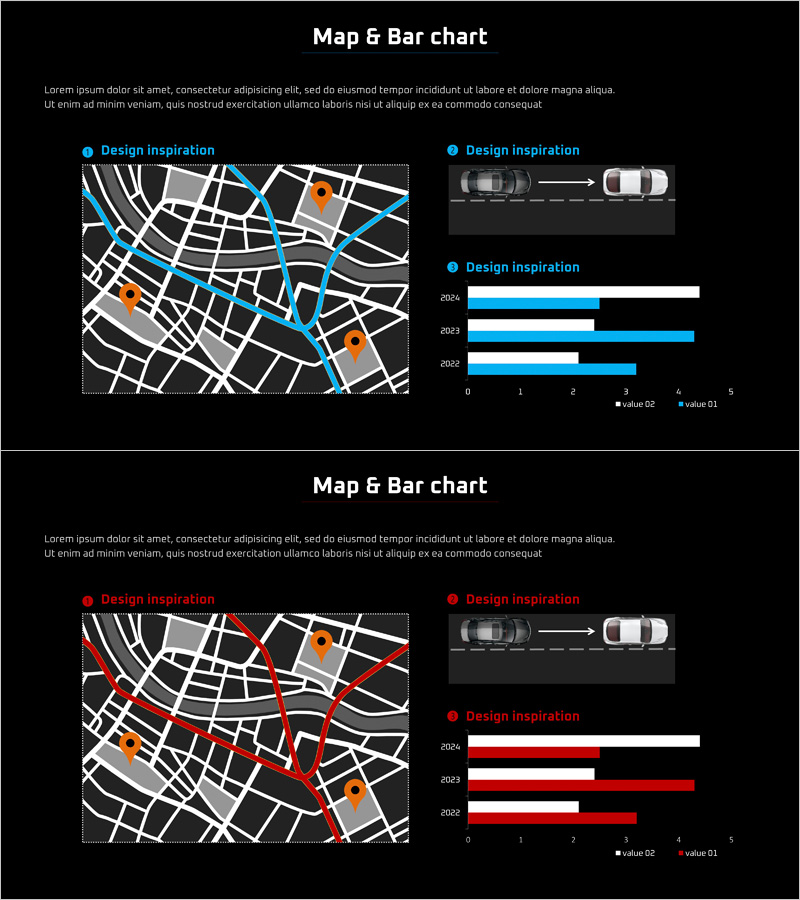
A 2-slide PowerPoint set combining navigation guidance map visualization with multi-year data comparison bar chart. The first slide features a white road network map with blue route paths and orange location markers, ideal for global network, logistics, and regional analysis presentations. The second slide displays a horizontal bar chart comparing data across 2024, 2023, and 2022 with two data series, optimized for numerical comparison, growth rate analysis, and market share visualization. Black background with blue and orange accent colors creates strong visual contrast for presentation impact. Delivered in 16:9 widescreen PPTX format, fully editable and ready to customize.
Usage Points
-
Main Usage
Combines geographic visualization through map markers and route paths with temporal data analysis via horizontal bar chart to present global networks, regional performance, and year-over-year trends. The map layer communicates spatial information intuitively while the dual-series bar chart clearly displays numerical comparisons across three fiscal years, supporting market analysis and competitive positioning narratives.
-
How to Use
Customize the first slide by adjusting marker locations and route paths to represent project sites, regional coverage, or distribution channels relevant to your business. On the second slide, modify year labels and series names, then input your actual data values to compare metrics such as revenue, market share, or customer volume. Color scheme (blue and orange) can be adjusted to match corporate branding guidelines.
-
Recommended For
Executive teams, marketing departments, sales organizations, and strategic planning units presenting quarterly or annual performance reviews, competitive landscape analysis, and global business status reports. Particularly suited for investor presentations, board meetings, and business development pitches requiring regional performance comparison and multi-year trend visualization.
-
Slide Structure
Slide 1: White road network map background with 3 blue route paths and 4 orange location markers positioned across geographic regions / Slide 2: Horizontal bar chart with 3 years (2024, 2023, 2022), 2 data series (value 02, value 01), numeric axis 0-5, and legend indicator
Related Products
-

Cybersecurity Business Market Analysis Graph
#Market and Competitor Analysis #Graph #Competitor Analysis
-

Horizontal Bar Graph for Competitor Analysis – Effective Data Visualization
#Market and Competitor Analysis #Graph #Competitor Analysis
-

Competitor Website Analysis Graph – Market and Competitor Analysis
#Market and Competitor Analysis #Graph #Competitor Analysis
-

Medical Record Analysis Bar Graph – Market and Competitor Analysis
#Market and Competitor Analysis #Graph #Competitor Analysis
