Business Plan Presentation Template - World Wide Map
RJ0200027_11
- Last Update 04/05/2025
- File Size 1.9MB
- # of Slides 2
- File Format PPTX
- Slide Ratio 16:9
- Color
Keywords
- #Content-Based Slides
- #Design-Based Slides
- #Market and Competitor Analysis
- #Financial Plans and Performance
- #Graph
- #Other
- #Market Analysis
- #Sales and Revenue
- #Column
- #Column Chart
- #Map
- #16:9
- #world map PowerPoint slide
- #regional data visualization
- #horizontal bar chart presentation
- #global market analysis slide
- #map-based chart template
- #geographic data PPT
About the Product
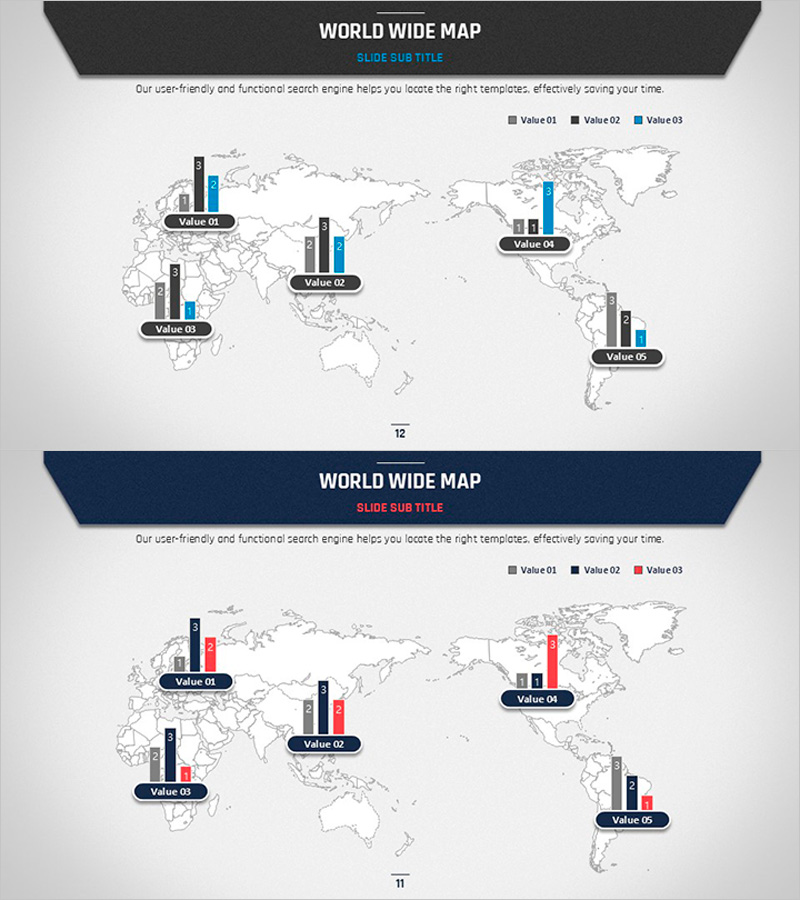
A comprehensive PowerPoint slide combining a world map with horizontal bar charts for global market analysis and regional performance comparison. This slide features a grayscale world map with five key regions (Asia, Europe, Africa, North America, South America) each displaying a horizontal bar chart with three data series differentiated by color (gray, black, and blue or gray, black, and red). Perfect for visualizing complex multi-region datasets including sales figures, customer distribution, market share, or regional KPIs. The 16:9 format slide set includes two variations and is fully editable for immediate use in business plans, market analysis reports, investor presentations, and strategic planning meetings.
Usage Points
-
Main Usage
Display and compare regional performance metrics, market size, customer distribution, or sales data across five global regions simultaneously. The world map layout provides geographic context while the bar charts enable precise numerical comparison, making complex international data immediately understandable.
-
How to Use
Input your regional data (sales, customer count, market share, or other KPIs) into the horizontal bar charts for each region. Use in business plan presentations, market analysis reports, investor pitch decks, and global strategy meetings to highlight regional performance disparities and opportunities.
-
Recommended For
International business managers, marketing strategists, financial analysts, executives, and investors. Particularly effective for multinational corporations presenting regional sales performance, market entry strategies, global expansion plans, or competitive regional analysis.
-
Slide Structure
Two-slide set with grayscale world map background. Each slide displays five regions with three-series horizontal bar charts positioned at Asia, Europe, Africa, North America, and South America. Includes 'Value 01' through 'Value 05' labels and color-coded legend. Second slide offers color variation (gray/black/red palette) for design flexibility.
Related Products
-

Infographic Design Wide Template Map&Table
#Market and Competitor Analysis #Financial Plans and Performance #Diagram
-

Market Sales and Profit Analysis with Bar Chart – Analysis and Insights
#Market and Competitor Analysis #Financial Plans and Performance #Graph
-

Target Country Analysis Bar Graph – Insights into Global Markets
#Company Introduction #Market and Competitor Analysis #Graph
-

Global Market Analysis Map – Importance of Market Connectivity
#Company Introduction #Market and Competitor Analysis #Graph
