Market Competition: Deep Dive into Top 3 Firms
RB0800034_7
- Last Update 03/25/2025
- File Size 1.4MB
- # of Slides 2
- File Format PPTX
- Slide Ratio 4:3
- Color
Keywords
About the Product
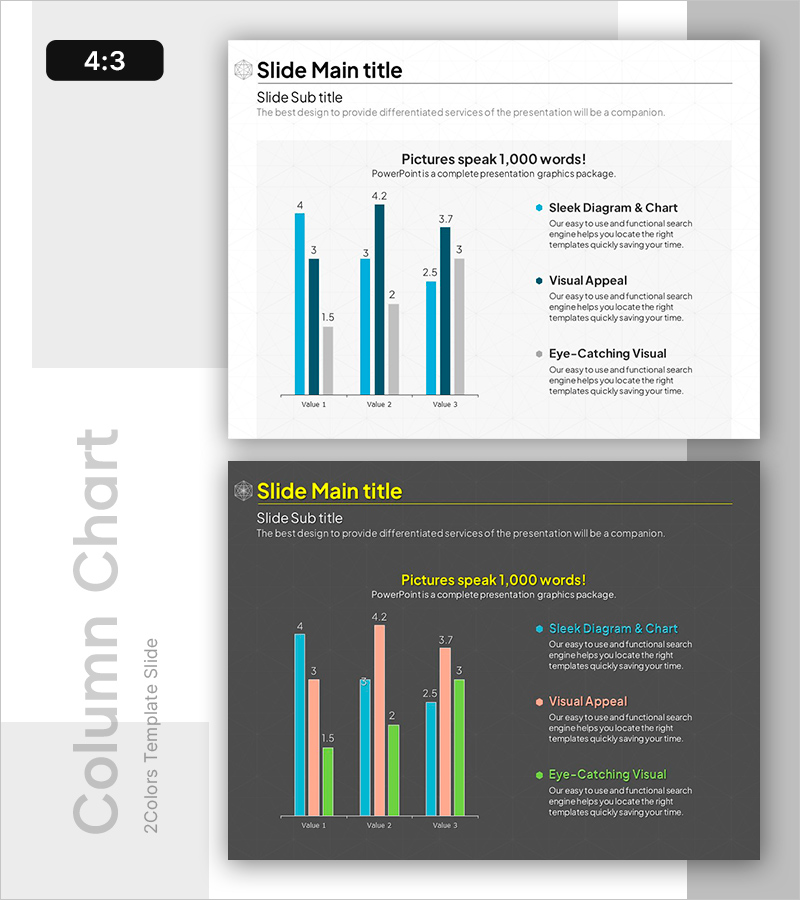
A clustered bar chart PowerPoint slide set designed for competitive market analysis. Visualizes key metrics across three competing firms using dual-axis horizontal and vertical bar representations. The design employs three distinct color series—teal, dark blue, and gray—to differentiate each company, with clear numerical labels and legend integration. Ideal for presentations, reports, and strategic planning documents where competitive positioning needs to be communicated effectively. Ready-to-use slide template for immediate deployment in business presentations.
Usage Points
-
Main Usage
Enables side-by-side comparison of three competitors across multiple performance metrics. The clustered bar format allows viewers to quickly assess relative strengths and weaknesses in market positioning, making it essential for competitive intelligence and strategic decision-making.
-
How to Use
Insert into executive presentations, strategic planning sessions, investor briefings, and marketing strategy documents during competitive landscape analysis sections. Use bar heights to compare numerical values and legends to clearly identify company names and metric categories.
-
Recommended For
Strategy teams, marketing departments, executives, management consultants, and business development professionals preparing competitive analysis materials. Particularly valuable for market entry strategies, product positioning, and competitive benchmarking initiatives.
-
Slide Structure
Two-slide set: Slide 1 features a clustered bar chart with three color series (3 companies × 3 metrics = 9 bars); Slide 2 presents the same structure on a dark background. 4:3 aspect ratio, fully editable PPTX format with all elements customizable.
Related Products
-

Four Color Infographic Bar Chart Template – Visualize Your Competitive Advantage
#Market and Competitor Analysis #Graph #Competitor Analysis
-

Market Insights Through Competition Analysis Chart – Gaining Competitive Edge
#Market and Competitor Analysis #Graph #Competitor Analysis
-

Triangular Pattern Column Chart Template – Market Competitive Advantage Analysis
#Market and Competitor Analysis #Graph #Competitor Analysis
-

Vertical Bar Chart for Data Analysis Visualization – Efficiency and Practicality
#Market and Competitor Analysis #Graph #Competitor Analysis
