Travel App Competitor Analysis Vertical Bar Chart
RJ0600053_6
- Last Update 07/04/2025
- File Size 0.6MB
- # of Slides 2
- File Format PPTX
- Slide Ratio 16:9
- Color
Keywords
- #Content-Based Slides
- #Design-Based Slides
- #Market and Competitor Analysis
- #Graph
- #Competitor Analysis
- #Competitive Advantage
- #Column
- #Grouped Column
- #16:9
- #vertical bar chart PowerPoint
- #bar graph presentation slide
- #competitor analysis chart
- #data comparison template
- #travel app market analysis slide
About the Product
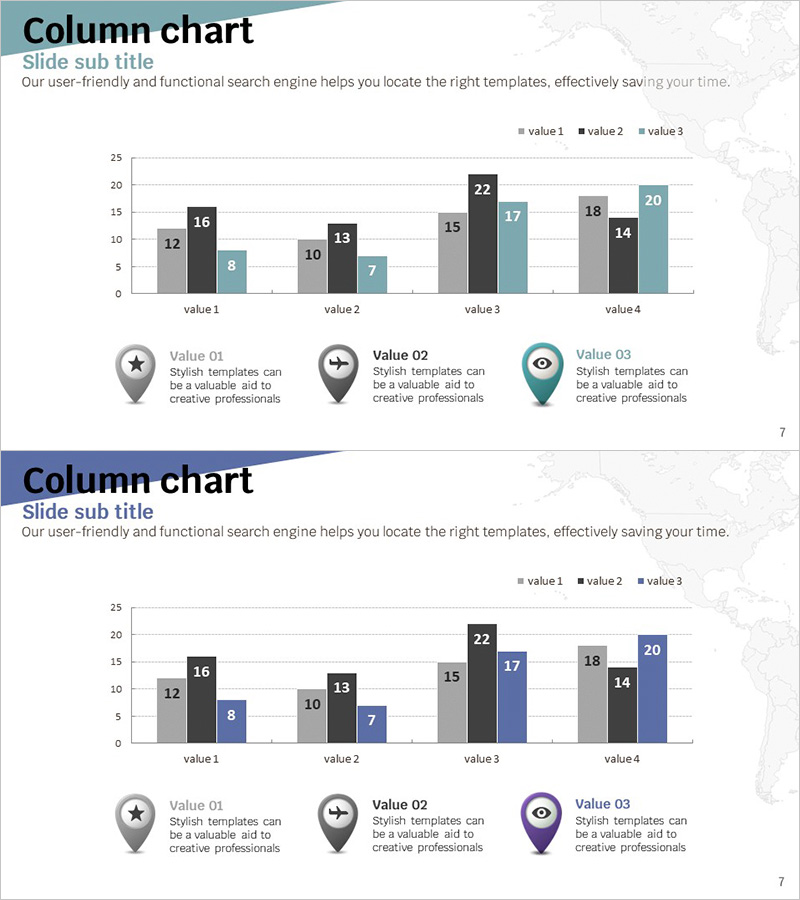
A vertical bar chart PowerPoint slide designed for analyzing travel application competitors. This presentation template displays 4 data categories with 3 series side-by-side, enabling clear numerical comparisons across competing apps. The bars use a three-tone color scheme—gray, black, and teal—to distinguish each competitor's performance metrics. The slide features a title and subtitle area at the top, with three icon-based explanation boxes at the bottom that highlight the meaning of each data series. This data visualization PPT is ready to use for market analysis, competitive positioning, and performance comparison presentations.
Usage Points
-
Main Usage
This slide enables data-driven comparison of travel app competitor performance metrics. By displaying 4 categories with 3 data series in bar format, it allows stakeholders to quickly identify competitive strengths and weaknesses. The layout is ideal for market analysis presentations, competitive positioning reports, and strategic planning discussions where numerical evidence is critical.
-
How to Use
Enter your analysis title in the top section (e.g., 'Travel App Download Comparison'). Replace the bar data with actual figures and update the legend labels (value1, value2, value3) with competitor names. Customize the three explanation boxes at the bottom with insights for each data series. Adjust colors and fonts to match your corporate branding guidelines.
-
Recommended For
Marketing professionals, business strategists, investment pitch presenters, market research analysts, and executive report creators. Particularly valuable for travel, tourism, hospitality, and airline industry app-based business analysis, startup investor relations materials, and competitive landscape reports.
-
Slide Structure
The template includes 2 slides with identical vertical bar chart layouts. Each chart features a Y-axis scale (0–25 range) and X-axis categories (value1–4), with 3 bars positioned side-by-side for each category. Data labels appear above each bar for clarity. Three icon-based text boxes (star, compass, eye icons) at the bottom provide space for interpreting each data series.
Related Products
-

Sales Status Table and Analysis – Clustered Column Charts for Competitor Analysis
#Market and Competitor Analysis #Graph #Text Box
-

Four Color Infographic Bar Chart Template – Visualize Your Competitive Advantage
#Market and Competitor Analysis #Graph #Competitor Analysis
-

Business Bundle Bar Graph – Market Analysis and Competitive Edge
#Market and Competitor Analysis #Graph #Competitor Analysis
-

Eco-friendly Icon Bar Graph Slide
#Market and Competitor Analysis #Diagram #Graph
