Market Analysis Slide for Major European Exporters
RJ0800048_10
- Last Update 08/13/2025
- File Size 1.1MB
- # of Slides 2
- File Format PPTX
- Slide Ratio 16:9
- Color
Keywords
- #Content-Based Slides
- #Design-Based Slides
- #Company Introduction
- #Market and Competitor Analysis
- #Graph
- #Other
- #Global Network
- #Market Share
- #Circles
- #Pie Chart
- #Map
- #16:9
- #Europe map PowerPoint slide
- #world map presentation template
- #regional market analysis PPT
- #geographic data visualization PowerPoint
- #export market analysis slide
About the Product
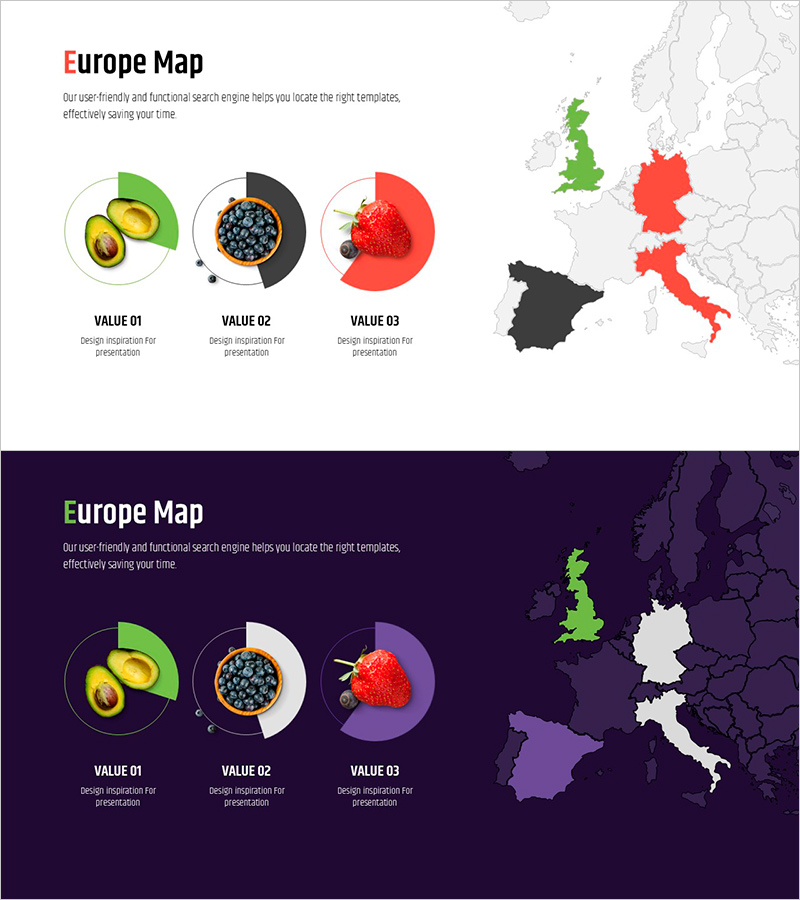
A geographic PowerPoint slide template designed to visualize market distribution across major European export countries. Features two design variations—light background and dark background—with countries highlighted in green, red, and black to represent market share, export volume, or regional performance. Three circular charts positioned alongside the map enable detailed data visualization for each region, such as product categories or market segments. Ideal for business presentations, market analysis reports, marketing strategy decks, and executive briefings. Provided in 16:9 widescreen PPTX format, fully editable in all PowerPoint versions.
Usage Points
-
Main Usage
Communicate European market size, export performance, and regional distribution through integrated map and chart visualization. Provides geographic context for international business strategy, competitive analysis, and market entry planning. Enables stakeholders to quickly grasp regional market dynamics and prioritize expansion opportunities.
-
How to Use
Click individual country shapes to modify colors or add data labels matching your market segments. Replace chart titles and values with your actual sales, export, or market share data. Use the light background version for printed reports and formal presentations; select the dark background for projector displays and virtual meetings.
-
Recommended For
International business managers, export-import specialists, global marketing strategists, market research analysts, C-level executives preparing regional performance reports, trade association educators, multinational company strategy teams
-
Slide Structure
Slide 1: Light background with Europe map (countries segmented in green, red, black) + three circular charts on left (VALUE 01/02/03 with fruit imagery: avocado, blueberries, strawberry). Slide 2: Dark purple background with identical map layout + three circular charts with enhanced border styling. Total 2 slides, 16:9 widescreen ratio.
Related Products
-

Detailed Location Map & Occupancy Graph – Market Share and Global Network
#Company Introduction #Market and Competitor Analysis #Graph
-

Global Map and Donut Chart – Visualizing Market Share
#Company Introduction #Market and Competitor Analysis #Graph
-

Target Country Analysis Map – Insights into Global Markets
#Company Introduction #Market and Competitor Analysis #Graph
-

Fruit Importers and Proportions – Global Distribution Strategy
#Company Introduction #Marketing Plan and Strategy #Graph
