Visualizing Market Analysis with Table and 3D Pie Chart
RJ0900009_9
- Last Update 08/18/2025
- File Size 0.1MB
- # of Slides 2
- File Format PPTX
- Slide Ratio 16:9
- Color
Keywords
- #Content-Based Slides
- #Design-Based Slides
- #Market and Competitor Analysis
- #Financial Plans and Performance
- #Diagram
- #Graph
- #Market Share
- #Sales and Revenue
- #Table
- #Circles
- #Standard Table
- #Pie Chart
- #16:9
- #pie chart PowerPoint slide
- #3-segment pie chart template
- #market analysis presentation
- #proportion data visualization
- #pie chart download
About the Product
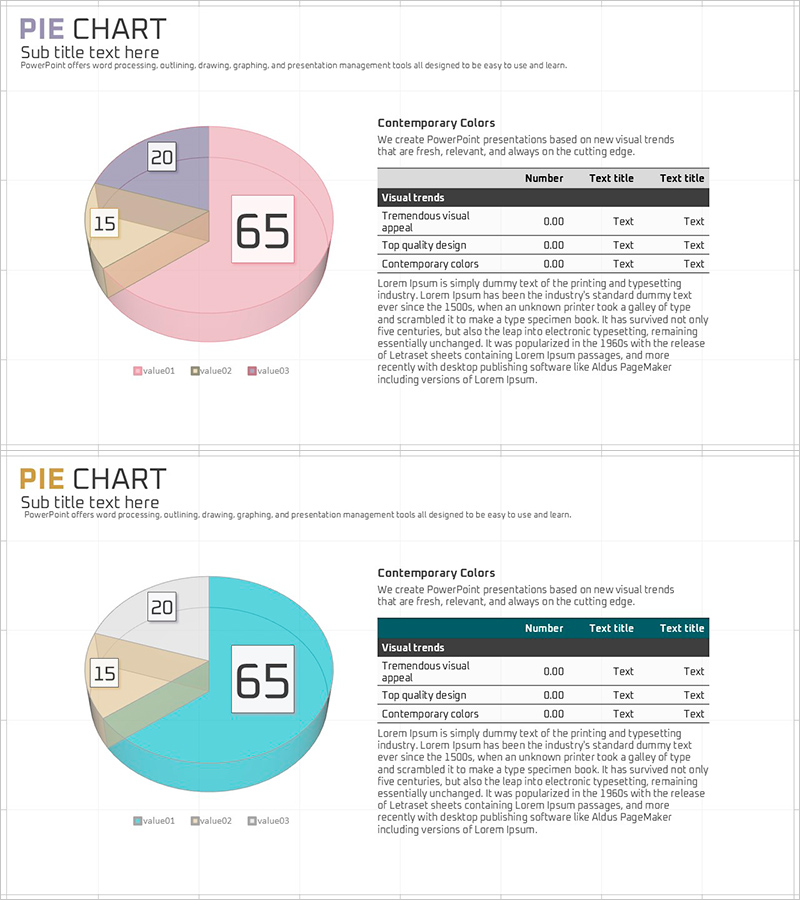
A 2-slide PowerPoint presentation set that visualizes market analysis data using 3D pie charts and comparative data tables. The first slide features a three-segment pie chart in pink, beige, and gray tones with a central numeric emphasis area and legend clearly displaying each segment's proportion. The second slide combines a teal-toned pie chart with a parallel-positioned information table on the right, enabling simultaneous delivery of visual and numerical data. Created in 16:9 widescreen format optimized for modern presentation environments, this template is ready for immediate use in expressing proportional data such as financial performance, market share, and customer distribution.
Usage Points
-
Main Usage
Expresses proportional data of 3–4 items such as market share, customer distribution, revenue composition, and product proportion using a pie chart, with numerical details presented in a right-side table. This dual-information delivery structure allows presenters to emphasize both visual and numerical aspects simultaneously, enabling highly credible data communication.
-
How to Use
Use in the market overview section when presenting financial reports, business analysis, or marketing strategy. Edit each pie segment and legend to match your data, then input numerical values and item names into the right-side table. Select either the pink or teal color tone to align with your overall presentation design.
-
Recommended For
Recommended for finance team members, marketing professionals, and executives preparing report materials who handle quantitative business analysis, market research, and customer segmentation data. Particularly valuable for strategy meetings, investor presentations, and quarterly performance reviews requiring credible data representation.
-
Slide Structure
Slide 1: 3-segment pie chart in pink, beige, and gray + central numeric emphasis box + legend / Slide 2: teal-toned 3-segment pie chart + right-side information table (3 rows × 3 columns) + visual trend description text. Both slides in 16:9 widescreen format, PPTX file type with all elements fully editable.
Related Products
-

Square Frame Presentation Template – Pie Chart & Table
#Market and Competitor Analysis #Financial Plans and Performance #Diagram
-

Pie Chart and Table Metrics – Market Share Analysis
#Market and Competitor Analysis #Financial Plans and Performance #Diagram
-

ABSTRACT PATTERN Presentation PIE CHART – Clearly Visualize Market Share
#Market and Competitor Analysis #Financial Plans and Performance #Diagram
-

Chart Analysis of Aerobic Exercise – Market Share Visualization
#Market and Competitor Analysis #Diagram #Graph
