Entertainment Business Analysis Graph - Market Analysis and Marketing Strategy
RJ0300049_18
- Last Update 05/01/2025
- File Size 1.7MB
- # of Slides 2
- File Format PPTX
- Slide Ratio 16:9
- Color
Keywords
- #Content-Based Slides
- #Design-Based Slides
- #Market and Competitor Analysis
- #Marketing Plan and Strategy
- #Diagram
- #Graph
- #Market Analysis
- #Marketing Strategy
- #Cluster
- #Circles
- #Chain Diagram
- #Doughnut Chart
- #16:9
- #donut chart PowerPoint
- #pie chart slide template
- #ratio analysis presentation
- #data visualization slides
- #business analysis PowerPoint
- #how to create donut chart in PowerPoint
About the Product
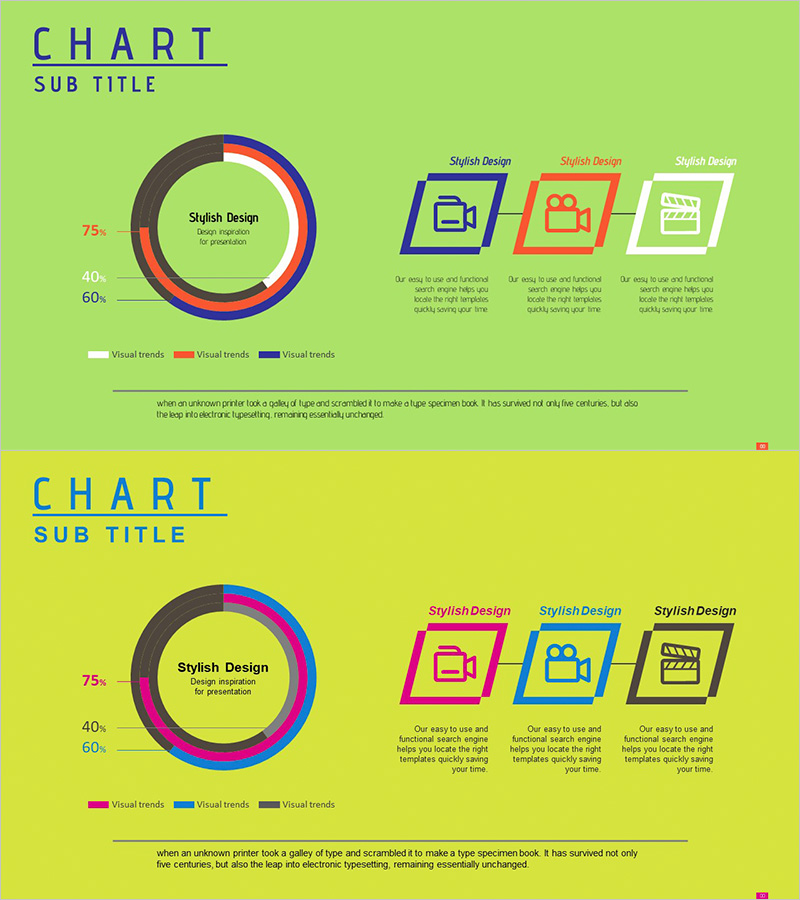
A 2-slide PowerPoint set featuring a 3-series donut chart on a lime green background. The center area accommodates key metrics, making it ideal for visualizing market share, customer composition, and revenue distribution. Multi-color donut rings in gray, red, blue, and orange distinguish each data segment, with icon boxes and text descriptions positioned on the right. Ready-to-use for business presentations, market analysis, and marketing strategy reports requiring clear data visualization.
Usage Points
-
Main Usage
Visualize proportional data such as market share, customer segments, revenue allocation, and budget distribution using donut chart format. The center area highlights key metrics (percentages or amounts), enhancing data credibility in business analysis, marketing strategy, and financial reports.
-
How to Use
Adjust donut ring colors and proportions to match your data, then input category names and descriptions in the right-side icon boxes. Enter the primary metric (e.g., 75% market share) in the center text field to draw audience attention. Optimized for 16:9 widescreen display.
-
Recommended For
Marketing managers, executives, business analysts, and finance professionals presenting market analysis, competitive comparison, customer segmentation, and budget allocation. Suitable for entertainment, consumer goods, financial services, and retail industry business reports and strategic planning presentations.
-
Slide Structure
Both slides feature identical layout: 3-series donut chart on the left with center input area, three icon boxes on the right for item descriptions. Lime green background with gray, red, blue, and orange donut rings. Legend and numeric input areas are clearly defined.
Related Products
-

Triangular Pattern Presentation Template for Doughnut Chart
#Market and Competitor Analysis #Marketing Plan and Strategy #Graph
-

Market Competitive Advantage Analysis with Donut Graph
#Market and Competitor Analysis #Diagram #Graph
-

Visual Insights on Education Analysis PowerPoint
#Market and Competitor Analysis #Diagram #Graph
-

Marketing Strategy Diagram & Graph – Optimized for Market and Competitive Analysis
#Market and Competitor Analysis #Marketing Plan and Strategy #Diagram
