Pie Chart of Camping Business Market Share by European Country
RJ0600078_16
- Last Update 07/11/2025
- File Size 0.9MB
- # of Slides 2
- File Format PPTX
- Slide Ratio 16:9
- Color
Keywords
- #Content-Based Slides
- #Design-Based Slides
- #Market and Competitor Analysis
- #Graph
- #Other
- #Market Share
- #Market Analysis
- #Circles
- #Pie Chart
- #Map
- #16:9
- #Europe map pie chart PowerPoint
- #geographic data visualization slides
- #country market share comparison
- #regional data presentation template
- #world map chart PPT download
About the Product
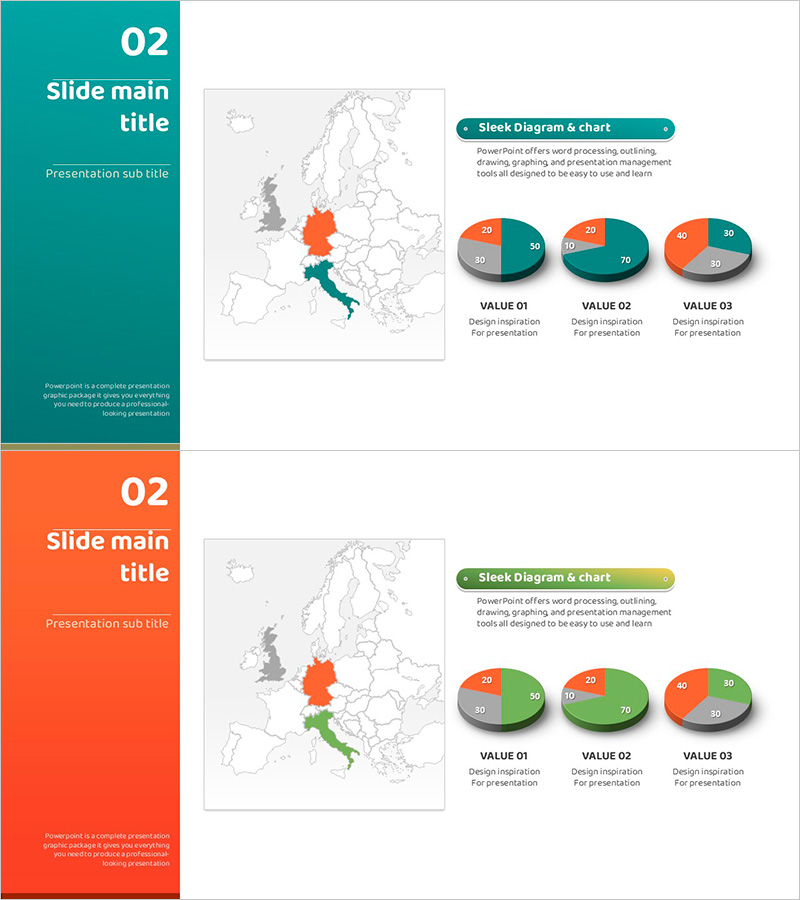
A PowerPoint slide that visualizes European country data using an integrated map and pie chart design. The left side features a Europe map with countries highlighted in distinct colors (orange, teal, gray) to emphasize specific regions, while the right side displays three pie charts for direct comparison of market share, percentages, and composition across regions. Each pie chart contains 4–5 segments with clear numerical labels and legends. The 2-slide set offers two color themes (teal background with orange accents, and orange background with green accents) to adapt to different presentation contexts. Ideal for camping industry analysis, tourism statistics, regional economic reports, and geographic data comparisons in business presentations.
Usage Points
-
Main Usage
This slide visualizes geographic data such as regional market share, sales volume, and customer distribution across European countries using pie charts. By highlighting countries on the map and displaying quantitative data in circular graphs, it enables clear comparison of regional differences and geographic trends.
-
How to Use
Edit the map colors and pie chart values with your own data. Use this slide when presenting camping business market analysis, tourism statistics, European regional sales performance, country-level customer composition, or geographic market penetration. The integrated map-chart design helps audiences quickly grasp regional patterns.
-
Recommended For
Marketing managers, business analysts, tourism and travel industry planners, regional economic researchers, and international business professionals analyzing geographic market data. Suitable for camping, hospitality, airlines, logistics, consumer goods, and any industry requiring regional market analysis.
-
Slide Structure
2-slide set. Each slide features a Europe map on the left (with countries highlighted in orange, teal, and gray) and three pie charts on the right (each with 4–5 segments and numerical labels). Title area at top, descriptive text space at bottom. Two color theme variations provided: teal-dominant and orange-dominant designs.
Related Products
-

Market Share Visualization of Three Countries – Effective Data Analysis
#Market and Competitor Analysis #Graph #Other
-

Target Market Share Analysis – Visualizing Market Analysis with Pie Chart
#Market and Competitor Analysis #Graph #Other
-

Focus Chart of Subject Proportions – Visualizing Market Share
#Market and Competitor Analysis #Graph #Market Share
-

Kids’ Study Time Planner – Market Share Visualization
#Market and Competitor Analysis #Graph #Market Share
