Modern Blue Template for Visualizing Market Competitiveness with Bar Chart
RJ0200035_11
- Last Update 04/07/2025
- File Size 2.4MB
- # of Slides 2
- File Format PPTX
- Slide Ratio 16:9
- Color
Keywords
- #Content-Based Slides
- #Design-Based Slides
- #Market and Competitor Analysis
- #Graph
- #Market Analysis
- #Competitive Advantage
- #Horizontal Bar
- #Double Horizontal Bar
- #16:9
- #horizontal bar chart PowerPoint
- #bar graph slide template
- #market competitiveness comparison
- #data visualization presentation
- #competitive analysis chart
About the Product
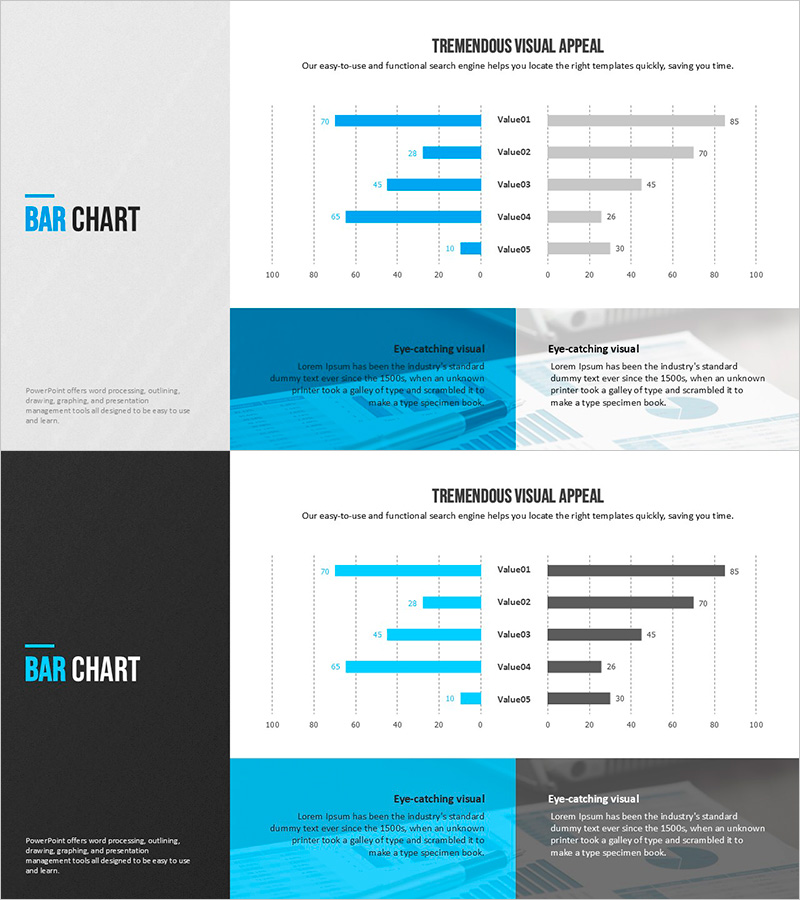
A horizontal bar chart PowerPoint slide designed to compare market competitiveness across five items at a glance. The slide features blue bars on the left and gray bars on the right, enabling dual-metric visualization with clearly labeled numerical values. Two versions are provided—one with a dark background and one with a light background—allowing you to match your presentation's overall tone. This slide effectively visualizes quantitative data such as competitive analysis, performance benchmarking, and market share in your presentation deck.
Usage Points
-
Main Usage
Presents quantitative data in a side-by-side comparison structure, clearly visualizing competitive analysis, performance metrics, and market share. Displays five items simultaneously with numerical values, allowing audiences to instantly grasp relative sizes and rankings.
-
How to Use
Use in executive reports, marketing plans, and business proposals within the market analysis section. Replace each bar's length and values with actual data, and update item labels (Value01–05) with corresponding competitor names or metric titles.
-
Recommended For
Recommended for executives, marketing professionals, sales teams, consultants, and analysts who base decisions on quantitative data. Ideal for competitive analysis presentations, performance evaluations, and market research findings.
-
Slide Structure
Two-slide layout: Slide 1 features a dark background (black left panel, gray right panel) with five horizontal bars; Slide 2 uses a light background (white left panel, light gray right panel) with identical structure. Each bar is rendered in two series—blue (left) and gray (right)—with numerical labels and legend included.
Related Products
-

Camera Bar Graph Paired – Market Analysis and Competitive Edge
#Market and Competitor Analysis #Graph #Market Analysis
-

Idea Presentation Template Wide Bilateral Bar Graph
#Market and Competitor Analysis #Graph #Market Analysis
-

Abstract Pattern Area Chart Template – Distinctive Data Visualization
#Market and Competitor Analysis #Graph #Other
-

Comparative Chart Analysis – Optimized for Market and Competitive Analysis
#Market and Competitor Analysis #Graph #Market Analysis
