Trend Visualization of Surgery for Market and Competitive Analysis
RJ0800019_18
- Last Update 08/04/2025
- File Size 3.6MB
- # of Slides 2
- File Format PPTX
- Slide Ratio 16:9
- Color
Keywords
- #Content-Based Slides
- #Design-Based Slides
- #Market and Competitor Analysis
- #Graph
- #Market Analysis
- #Competitive Advantage
- #Line
- #Line Chart
- #16:9
- #line chart PowerPoint slide
- #dual-series trend visualization
- #market analysis chart template
- #competitive comparison graph
- #how to create line chart in PowerPoint
About the Product
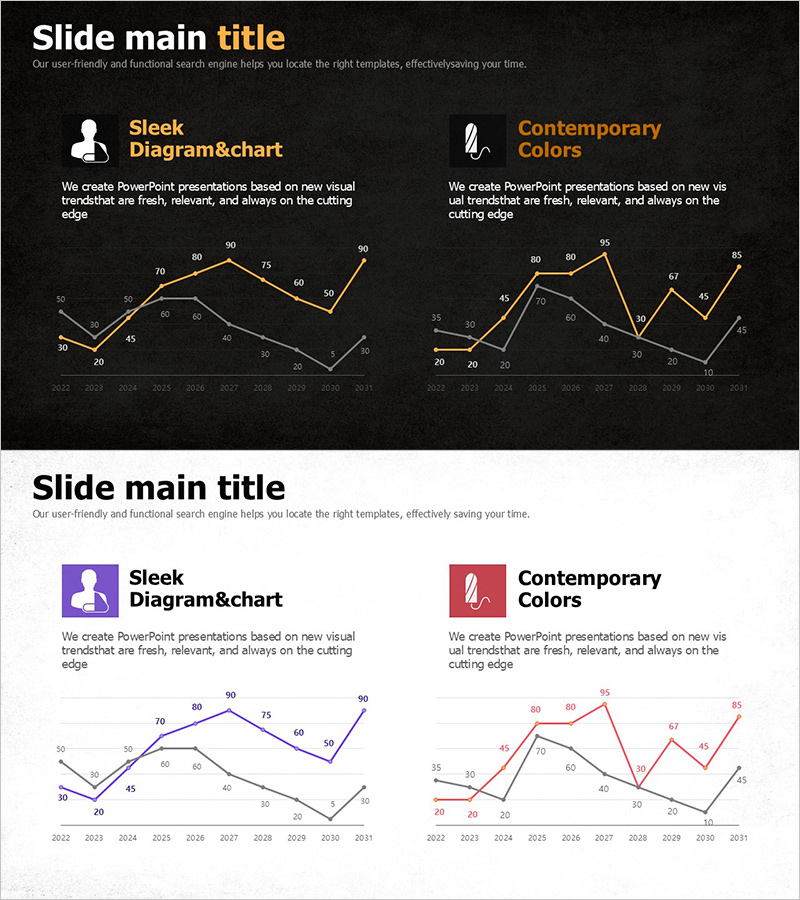
A dual-series line chart PowerPoint slide designed for market analysis and competitive benchmarking presentations. This slide visualizes two data streams over time, clearly showing trend changes from 2022 to 2031. The orange and gray color scheme distinguishes the two datasets, enabling side-by-side comparison of performance metrics. Ideal for healthcare statistics, market share analysis, sales forecasting, and competitive positioning reports that require immediate deployment.
Usage Points
-
Main Usage
Compares two datasets simultaneously across a time period, making it ideal for visualizing trend changes, market performance, and competitive metrics. Supports data-driven decision-making in strategic planning and performance reviews.
-
How to Use
Replace the sample data with your own statistics while maintaining the chart structure. Customize colors to match your brand identity or keep the existing orange and gray scheme. Adjust the year range and axis values to fit your specific data range.
-
Recommended For
Healthcare professionals presenting surgical trend reports, marketing teams analyzing market share, executives reviewing competitive positioning, consulting firms presenting industry analysis, academic researchers visualizing longitudinal data.
-
Slide Structure
Two-slide set, each featuring a dual-series line chart with X-axis showing years 2022–2031 and Y-axis displaying values 0–100. Data points are labeled with exact figures for clarity and precision in information delivery.
Related Products
-

Pig Family and Market Analysis Graph Slide
#Market and Competitor Analysis #Graph #Market Analysis
-

Bell Charts for Various Topics – Market Competition Analysis
#Market and Competitor Analysis #Graph #Market Analysis
-

Brown Blue Detailed Analysis Chart - Market and Competitor Analysis
#Market and Competitor Analysis #Diagram #Graph
-

Customer Analytics Bell Diagram – Competitive Advantage Analysis
#Market and Competitor Analysis #Graph #Market Analysis
