Camera Bar Graph Paired – Market Analysis and Competitive Edge
RJ0500021_13
- Last Update 06/12/2025
- File Size 1.1MB
- # of Slides 2
- File Format PPTX
- Slide Ratio 16:9
- Color
Keywords
- #Content-Based Slides
- #Design-Based Slides
- #Market and Competitor Analysis
- #Graph
- #Market Analysis
- #Competitive Advantage
- #Horizontal Bar
- #Double Horizontal Bar
- #16:9
- #paired horizontal bar chart PowerPoint
- #comparative bar graph template
- #data comparison slide
- #market analysis PowerPoint template
- #how to create paired bar chart in PowerPoint
About the Product
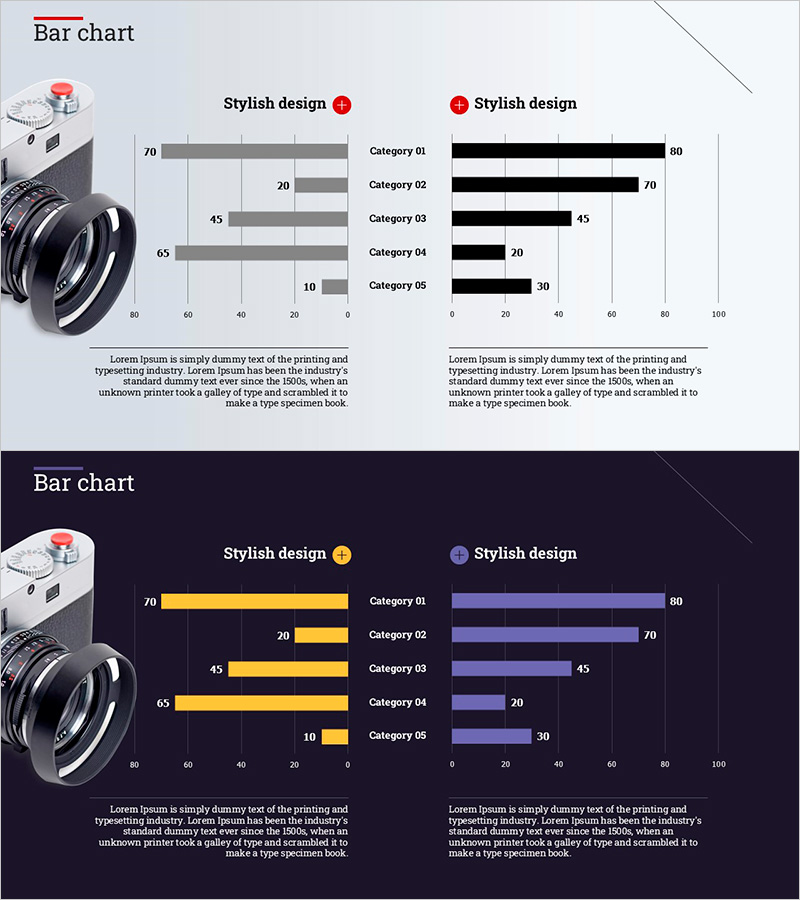
A paired horizontal bar chart PowerPoint slide featuring a camera image with five categories displayed in left-right symmetrical comparison. Available in four color combinations: gray-black, orange-purple, and additional variants for visual distinction between two independent data series. Designed for market analysis, competitive benchmarking, and performance comparisons, this slide template enables instant presentation of contrasting datasets. Clear text areas and numeric input fields facilitate easy editing. The 16:9 widescreen format spans two slides, accommodating multiple comparison scenarios.
Usage Points
-
Main Usage
Visualizes two contrasting data series simultaneously to enhance comparative analysis. Ideal for market share comparisons, competitive performance benchmarking, year-over-year growth rates, forecast versus actual results, and any presentation requiring side-by-side data evaluation.
-
How to Use
Input category labels and numeric values; bar lengths adjust automatically. Select color combinations (gray-black or orange-purple) to visually distinguish the two data series. Replace the camera image with industry-specific or topic-relevant imagery as needed.
-
Recommended For
Marketing professionals, sales strategists, financial analysts, executive report presenters, management consultants, market research specialists, and business intelligence teams requiring quantitative comparative analysis.
-
Slide Structure
Two-slide set. Each slide features five horizontal bars on the left (0–80 scale) and five on the right (0–100 scale), with category labels centered between them. Includes title area at top and descriptive text section at bottom for context.
Related Products
-

Modern Blue Template for Visualizing Market Competitiveness with Bar Chart
#Market and Competitor Analysis #Graph #Market Analysis
-

Idea Presentation Template Wide Bilateral Bar Graph
#Market and Competitor Analysis #Graph #Market Analysis
-

Line Chart for Visualizing Data Changes – Effective Information Delivery
#Market and Competitor Analysis #Graph #Market Analysis
-

Visualizing Market and Competitor Analysis with Bilinear Bar Graph
#Market and Competitor Analysis #Graph #Competitor Analysis
