Idea Presentation Template Wide Bilateral Bar Graph
RJ0200030_11
- Last Update 04/06/2025
- File Size 0.7MB
- # of Slides 2
- File Format PPTX
- Slide Ratio 16:9
- Color
Keywords
- #Content-Based Slides
- #Design-Based Slides
- #Market and Competitor Analysis
- #Graph
- #Market Analysis
- #Competitive Advantage
- #Horizontal Bar
- #Double Horizontal Bar
- #16:9
- #bilateral bar chart PowerPoint
- #left-right comparison slide
- #dual data visualization
- #symmetrical bar graph template
- #comparison chart PowerPoint slide
About the Product
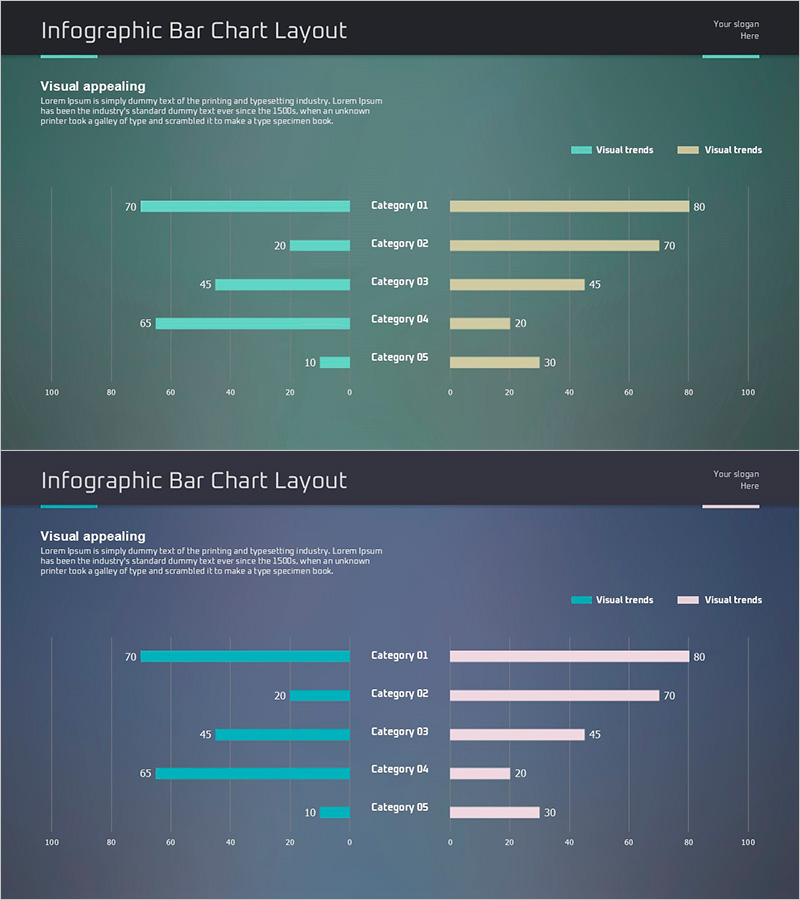
A symmetrical bilateral bar chart PowerPoint slide for comparing two data series across five categories. The left side displays teal bars while the right side shows beige bars, creating a mirror-image layout ideal for competitive analysis, market comparison, and performance benchmarking. This 16:9 widescreen 2-slide template includes clear numerical labels and legend indicators, making it easy to present dual datasets in business presentations, reports, and strategic planning sessions. All elements are fully editable and ready for immediate use.
Usage Points
-
Main Usage
Presents two groups of data in a symmetrical left-right layout to enable intuitive comparative analysis. Ideal for market share comparison, competitive performance benchmarking, budget allocation review, regional sales comparison, and any scenario requiring simultaneous emphasis on relative magnitude and differences between two data sets.
-
How to Use
Enter numerical values in the left and right bar fields for each category; bar lengths adjust automatically. Modify legend colors (teal and beige) to match your brand palette by right-clicking the color elements. Double-click category labels and numerical values to edit text. Duplicate rows to add additional categories beyond the default five.
-
Recommended For
Marketing professionals presenting market analysis, sales teams comparing competitor performance, finance teams explaining budget allocation, strategic planning meetings requiring dual-metric comparison, consulting firms preparing client proposals, and academic presentations of comparative statistical data.
-
Slide Structure
2-slide template with title area, descriptive text box, and bilateral bar chart section. Five category rows with teal bars extending left and beige bars extending right from a center axis. Numerical labels appear at the end of each bar, with color-coded legend at the top of the chart area.
Related Products
-

Modern Blue Template for Visualizing Market Competitiveness with Bar Chart
#Market and Competitor Analysis #Graph #Market Analysis
-

Camera Bar Graph Paired – Market Analysis and Competitive Edge
#Market and Competitor Analysis #Graph #Market Analysis
-

Competitor Analysis Bilinear Bar Graph – Visualizing Market Advantage
#Market and Competitor Analysis #Graph #Competitor Analysis
-

Competitive Advantage Bar Graph – Market and Competitor Analysis
#Market and Competitor Analysis #Graph #Competitor Analysis
