Writing Instrument Icon Pie Chart – Company Introduction and Product Achievements
RJ0500022_8
- Last Update 06/13/2025
- File Size 3.8MB
- # of Slides 2
- File Format PPTX
- Slide Ratio 16:9
- Color
Keywords
About the Product
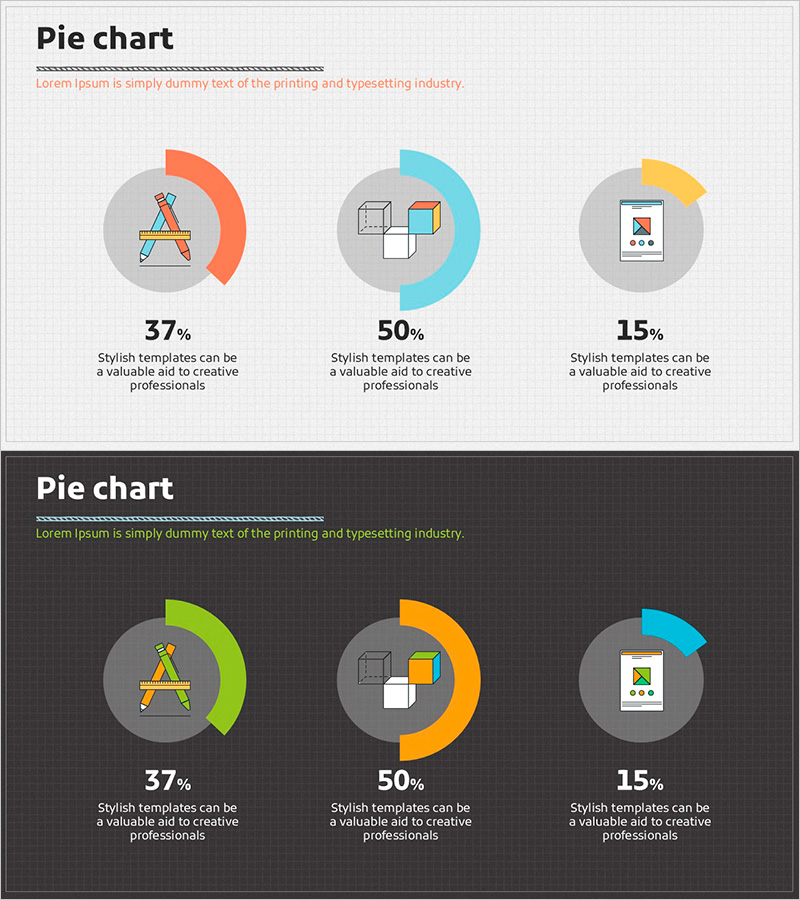
A three-segment pie chart PowerPoint slide featuring writing instrument icons for data visualization. Available in two color schemes—light background and dark background—with orange, cyan, and yellow accent colors applied to each section. This presentation slide effectively communicates ratio-based data such as company overview, product performance, and market share. Includes 2 slides optimized for 16:9 widescreen format in PPTX.
Usage Points
-
Main Usage
Visualize proportion, composition, and market share data using a pie chart format. The three segments allow immediate comparison of relative sizes, while icons convey the meaning of each category intuitively. Suitable for company introductions, product performance presentations, market analysis, and customer demographic breakdowns.
-
How to Use
Edit the percentage values and descriptive text in each section to match your data. Choose the light background version for bright presentation venues or the dark background version for dimly lit rooms. Icons and colors can be customized to align with your corporate brand identity.
-
Recommended For
Marketing managers, sales directors, executives preparing reports, product planning teams, and market analysts. Particularly effective for presentations requiring ratio-based data representation, such as company overviews, product performance reports, and quarterly business reviews.
-
Slide Structure
Two-slide set, each featuring a three-segment pie chart as the focal point. Each segment includes an icon, percentage value, and descriptive text. Two color schemes provided: light gray background and charcoal gray background for flexible venue adaptation.
Related Products
-

Newspaper Wide PowerPoint Template with Donut Chart for Key Achievements
#Company Introduction #Product/Service Introduction #Graph
-

Little Witch and Donut Chart – Visualizing Achievements in Presentation Slide
#Company Introduction #Product/Service Introduction #Graph
-

Donut Diagram Visualizing Technology Development Status
#Company Introduction #Product/Service Introduction #Diagram
-

Ability Donut Chart for Performance Visualization – Emphasizing Key Achievements
#Company Introduction #Product/Service Introduction #Graph
