Geometry PPT Template Wide Horizontal Bar Segmentation Graph
RJ0200034_21
- Last Update 04/07/2025
- File Size 0.1MB
- # of Slides 2
- File Format PPTX
- Slide Ratio 16:9
- Color
Keywords
- #Content-Based Slides
- #Design-Based Slides
- #Market and Competitor Analysis
- #Graph
- #Industry Trends
- #Competitive Advantage
- #Horizontal Bar
- #Segmented Horizontal Bar
- #16:9
- #segmented horizontal bar chart PowerPoint
- #4-series data comparison slide
- #market analysis presentation
- #competitive analysis chart
- #PowerPoint graph slide
- #data visualization template
About the Product
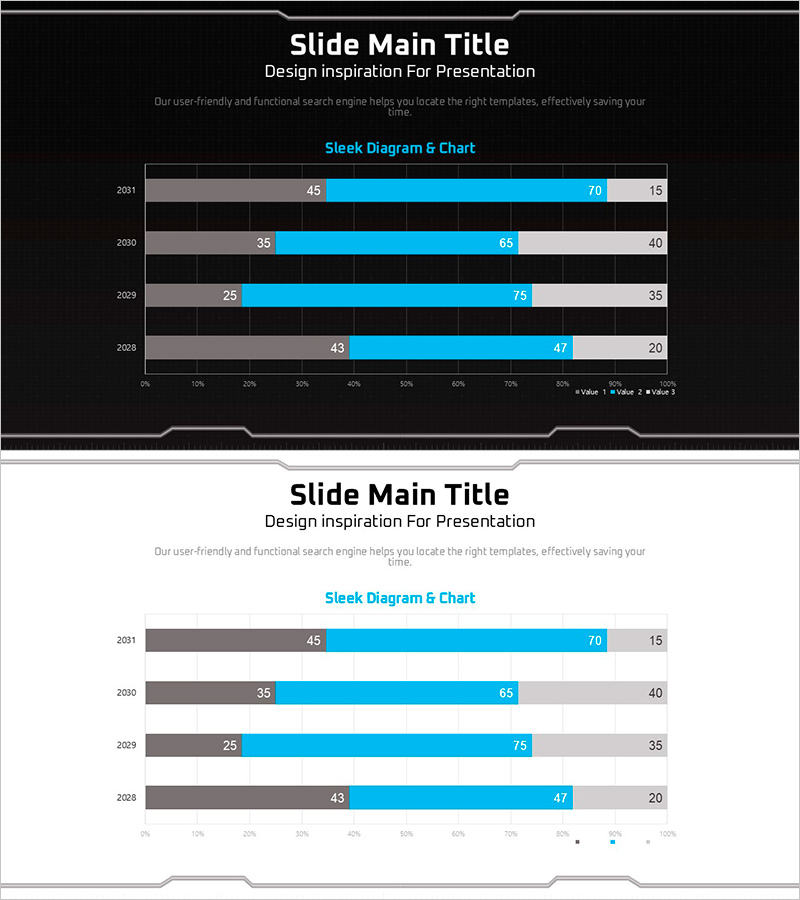
A segmented horizontal bar chart PowerPoint slide designed to compare 4-series data across multiple years. The dark theme features a black background with cyan blue accents and clear numerical labels for precise data visualization. This presentation slide is ideal for market analysis, competitive benchmarking, sales performance reporting, and business intelligence. The 2-slide set includes both dark and light theme versions optimized for 16:9 widescreen format, making it suitable for executive presentations and strategic planning documents.
Usage Points
-
Main Usage
Enables simultaneous comparison of multiple data series across time periods and categories. Effectively displays market size trends, competitor performance metrics, departmental sales figures, and product category revenue—ideal when presenting 4 or more comparable data points with temporal context.
-
How to Use
Each year row contains 4 adjacent bars representing different data series, allowing both within-year item comparison and year-over-year trend analysis. Simply edit the numerical labels to input your actual data and adjust colors to match your brand guidelines. The grid background aids precise value reading.
-
Recommended For
Executive reports, business plans, marketing strategy documents, and investor presentations. Particularly effective for financial analysis, market research, and competitive positioning sections. Widely used by consulting firms, financial institutions, and marketing teams to present quantitative evidence and performance metrics.
-
Slide Structure
2-slide set featuring dark theme (black background with cyan accents) and light theme (white background with gray and cyan combination). Each slide displays 4-series × 4-year data points (2011–2028) with legend and percentage scale indicators for comprehensive data representation.
Related Products
-

Touch Wide Slide Template – Segmentation Graph Usage
#Market and Competitor Analysis #Graph #Industry Trends
-

Variation Segmentation Graph for Reading Volume – Market Trend Insights
#Market and Competitor Analysis #Graph #Industry Trends
-

Analysis of Changes in Transportation Vehicles Using Horizontal Bar Chart
#Market and Competitor Analysis #Graph #Industry Trends
-

Turquoise Green Comparative Graph – Market Analysis and Trends
#Market and Competitor Analysis #Graph #Industry Trends
