Analysis of Changes in Transportation Vehicles Using Horizontal Bar Chart
RJ0900011_24
- Last Update 08/19/2025
- File Size 0.2MB
- # of Slides 2
- File Format PPTX
- Slide Ratio 16:9
- Color
Keywords
About the Product
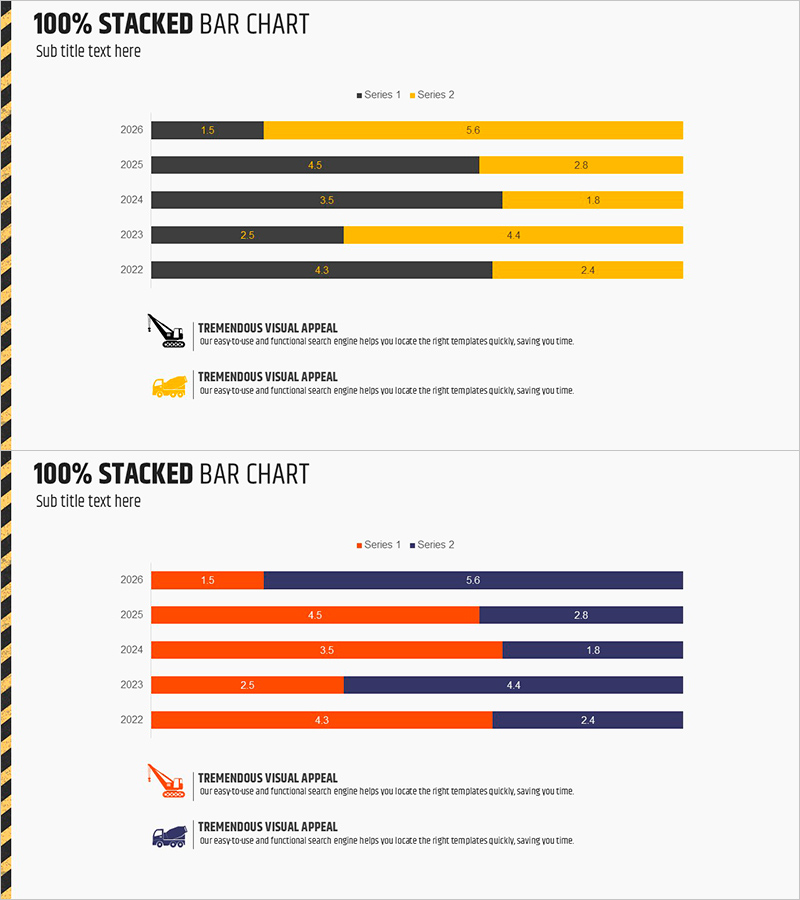
A 100% stacked horizontal bar chart PowerPoint slide for analyzing transportation vehicle trends from 2022 to 2026. This presentation slide visualizes five years of data across two distinct series using contrasting black and yellow colors for clear differentiation. The horizontal bars are normalized to 100%, showing the proportional changes of each series over time with embedded numerical labels for precise data interpretation. Ideal for business presentations, market analysis reports, sales comparisons, and market share trend discussions. Ready to use in quarterly reports, investor presentations, and strategic planning meetings.
Usage Points
-
Main Usage
The primary purpose is to compare year-over-year data changes across two series while simultaneously displaying the overall composition ratio. By using 100% stacking, each year maintains equal total width while emphasizing proportional shifts between series, making it ideal for market share analysis, revenue composition changes, and resource allocation trends.
-
How to Use
Use this slide in business reports, marketing presentations, investor briefings, and quarterly reviews when explaining compositional changes over time. The distinct black and yellow color scheme enables audiences to easily track both series, while embedded numerical values communicate precise percentages and actual figures for data-driven discussions.
-
Recommended For
Recommended for executives, marketing managers, sales teams, management consultants, and data analysts in transportation, logistics, retail, finance, and distribution sectors. Particularly effective for presentations analyzing multi-year trends, market dynamics, customer composition shifts, and competitive positioning.
-
Slide Structure
Two-slide layout featuring 100% stacked horizontal bars. First slide displays black and yellow series across five years (2022-2026); second slide shows red and navy blue series with the same structure. Each bar is normalized to 100% with series-specific value labels, legend indicators, and supplementary icons for enhanced clarity and context.
Related Products
-

Analyzing Flower Horizontal Segmentation Charts – Understanding Market Trends
#Market and Competitor Analysis #Graph #Industry Trends
-

Yellow Green Detailed Analysis Chart - Visualizing Market Trends
#Business Strategy #Market and Competitor Analysis #Diagram
-

Paint Piano and Segmentation Bar Graph – Market Trend Analysis
#Market and Competitor Analysis #Graph #Market Analysis
-

Eco-friendly Business Market Share Segmentation Horizontal Bar Chart
#Market and Competitor Analysis #Graph #Industry Trends
