Study Image and Horizontal Segmentation Bar Graph - Customer Analysis and Market Trends
RJ0500003_12
- Last Update 06/08/2025
- File Size 4.5MB
- # of Slides 2
- File Format PPTX
- Slide Ratio 16:9
- Color
Keywords
- #Content-Based Slides
- #Design-Based Slides
- #Market and Competitor Analysis
- #Graph
- #Customer Analysis
- #Industry Trends
- #Horizontal Bar
- #Segmented Horizontal Bar
- #16:9
- #horizontal bar chart PowerPoint
- #segmented bar graph template
- #data comparison slide
- #customer analysis chart
- #market trend visualization
About the Product
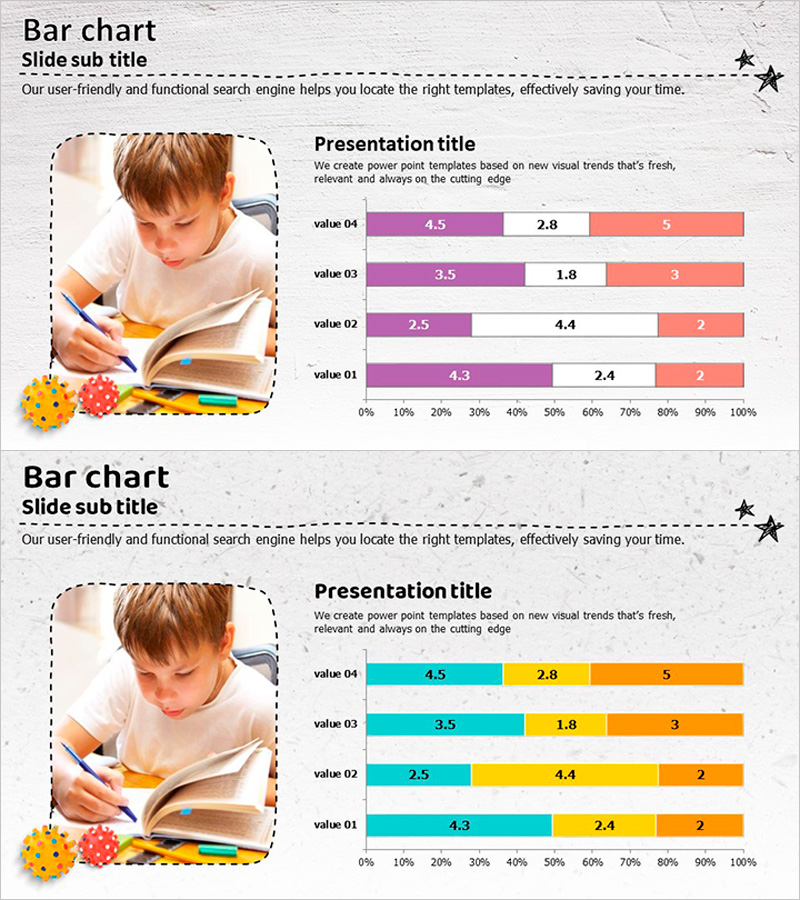
A horizontal segmented bar chart PowerPoint slide designed to visualize customer analysis and market trends. The slide features four data items displayed across three color series—purple, yellow, and orange—on a 0–100% scale for intuitive ratio comparison. The balanced layout combines a study image on the left with the chart on the right, enhancing presentation credibility. This 2-slide template is ready to use immediately, with fully editable colors and values for customization.
Usage Points
-
Main Usage
Ideal for comparing multiple data sets such as customer segmentation, market share, competitor benchmarking, and performance metrics. The horizontal layout maintains readability even with longer category names, while the four-series structure enables simultaneous display of complex analytical data.
-
How to Use
Use in marketing strategy presentations, customer analysis reports, market research findings, and sales performance reviews. Input actual data into the chart area on the right, and insert relevant images into the left image zone to enhance visual impact and audience engagement.
-
Recommended For
Marketing teams, sales departments, executives, consultants, and data analysts presenting quantitative comparisons. Particularly effective for customer segmentation, market trend analysis, competitive positioning, and performance evaluation presentations.
-
Slide Structure
2-slide template. Each slide is divided into a left image area (circular border) and a right chart area. The chart contains four rows (value 01–04), with each row displaying three horizontal bar series (purple, yellow, orange) on a 0–100% scale. Numeric labels appear above each bar segment for precise data communication.
Related Products
-

Eco-friendly Business Market Share Segmentation Horizontal Bar Chart
#Market and Competitor Analysis #Graph #Industry Trends
-

Horizontal Bar Segmentation Graph for Market Trend Analysis – Establishing Business Strategy
#Business Strategy #Market and Competitor Analysis #Graph
-

Visualizing Sales Performance Trends with a Bar Chart – Market Competitor Analysis
#Market and Competitor Analysis #Graph #Industry Trends
-

Changing Perceptions about Parental Support – Market Trend Analysis
#Market and Competitor Analysis #Graph #Customer Analysis
