Analysis Graph for Child – Market Trends
RJ0500032_17
- Last Update 06/15/2025
- File Size 1.2MB
- # of Slides 2
- File Format PPTX
- Slide Ratio 16:9
- Color
Keywords
- #Content-Based Slides
- #Design-Based Slides
- #Business Introduction
- #Market and Competitor Analysis
- #Graph
- #Industry Trends
- #Column
- #Segmented Column
- #16:9
- #vertical bar chart PowerPoint
- #market trend analysis presentation
- #4-year comparison slide
- #data visualization PPT
- #bar graph PowerPoint template
About the Product
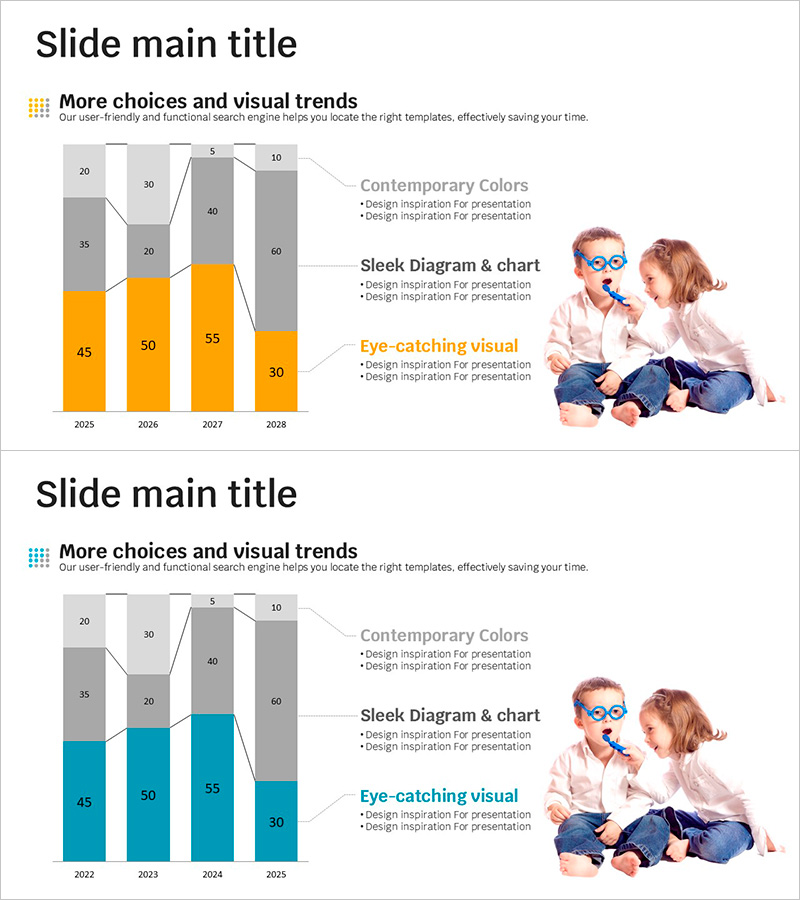
A vertical bar chart PowerPoint slide for analyzing child market trends across four years from 2025 to 2028. The slide presents data using two color series—gray and orange—to compare five data points per year, making numerical comparisons clear and visually compelling. The upper section features a section title 'More choices and visual trends' with descriptive text, while the right side includes a contemporary color palette explanation and child imagery. Delivered in 16:9 PPTX format for immediate editing, this slide is ready for marketing reports, market analysis presentations, business plans, and strategic briefings.
Usage Points
-
Main Usage
Effectively compare year-over-year market trend data using vertical bar visualization, communicating growth trajectories and market size changes in the child-related industry. The multi-series format enables simultaneous presentation of multiple data points, making trend identification and decision-making support more impactful.
-
How to Use
Integrate into the market analysis section of marketing reports, market overview pages in business plans, quarterly or annual performance briefings, and market size explanations in investor pitch decks. Simply replace the graph data and right-side text box with your own content to customize the slide.
-
Recommended For
Marketing professionals, market analysts, business planners, sales executives, and management reporting teams who need to communicate market trends persuasively. Particularly valuable for professionals in child-related industries including toys, education, entertainment, and consumer goods.
-
Slide Structure
Two-slide set with each slide featuring a top section title and description area, center vertical bar chart (4 years × 5 data points in gray and orange series), and right-side text box with imagery. Optimized for 16:9 widescreen presentation format.
Related Products
-

Brown Segmentation Bar Graph – Clear Market Trends
#Market and Competitor Analysis #Graph #Industry Trends
-

Hologram Wide PPT Table & Segmentation Bar Graph – Trendy Data Visualization
#Market and Competitor Analysis #Financial Plans and Performance #Diagram
-

Orange Export Trends Visualization Template – Market Growth
#Market and Competitor Analysis #Graph #Industry Trends
-

Market Trends Analysis Chart – Effective for Market and Marketing Strategy
#Market and Competitor Analysis #Marketing Plan and Strategy #Diagram
