Geometry PPT Template Wide Vertical Bar Chart – Market Analysis Tool
RJ0200034_15
- Last Update 04/07/2025
- File Size 0.1MB
- # of Slides 2
- File Format PPTX
- Slide Ratio 16:9
- Color
Keywords
- #Content-Based Slides
- #Design-Based Slides
- #Market and Competitor Analysis
- #Financial Plans and Performance
- #Graph
- #Market Analysis
- #Sales and Revenue
- #Column
- #Column Chart
- #16:9
- #vertical bar chart PowerPoint
- #bar graph slide template
- #market analysis chart
- #data comparison slide
- #business data visualization PPT
About the Product
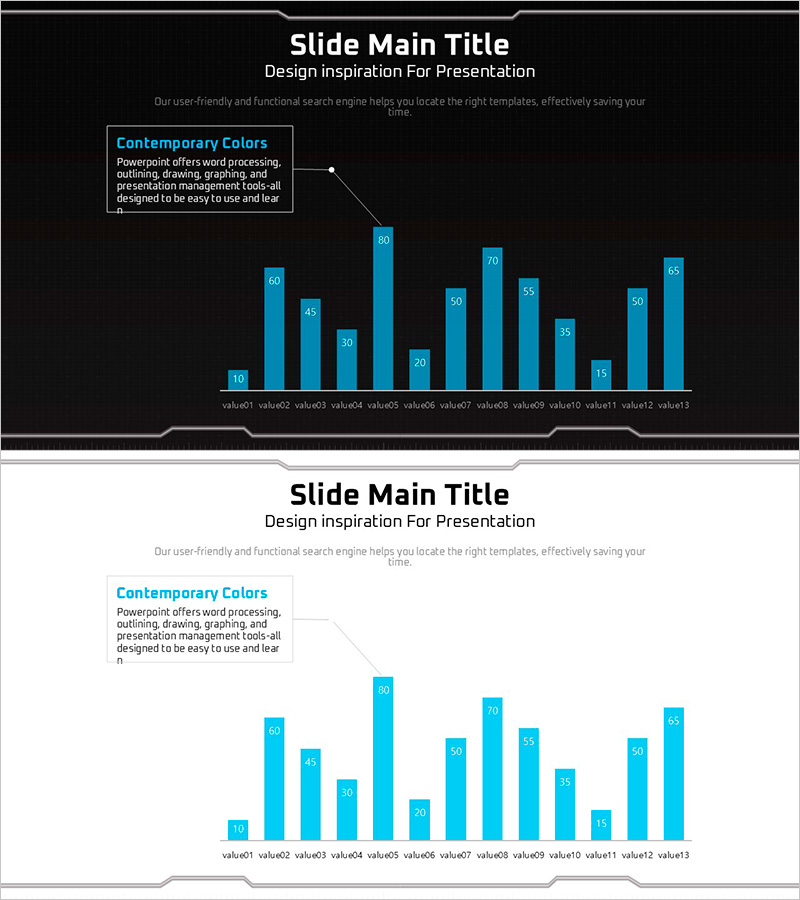
A vertical bar chart PowerPoint slide designed to clearly compare numerical data across 13 items. The high-contrast design features cyan-blue bars against a black background, making data stand out in presentations. Each bar displays a numerical label at the top for precise value communication, while geometric pattern elements add visual interest. This presentation slide is ready to use for market analysis, sales performance reports, competitive comparisons, and various business presentations. Optimized for 16:9 widescreen format in modern presentation environments.
Usage Points
-
Main Usage
This chart excels at comparing multiple data points through bar height, making it ideal for visualizing market size, sales volume, performance metrics, and competitive analysis. Numerical labels above each bar ensure precise value communication while maintaining visual clarity for your audience.
-
How to Use
Use this slide in business presentations, market analysis reports, quarterly performance reviews, and executive briefings. Simply input your actual data into the template, and it's ready to present. You can customize bar colors and background to match your corporate branding.
-
Recommended For
Marketing managers, sales directors, financial analysts, business intelligence professionals, and consultants who need to present quantitative data persuasively. Particularly effective for competitive analysis, market share visualization, and sales trend presentations.
-
Slide Structure
Two-slide set featuring black background and white background versions. Each slide displays a 13-item vertical bar chart with numerical labels above each bar. A legend text box on the left side allows for additional chart description and context.
Related Products
-

Analysis of Crises and Opportunities through Graphs
#Market and Competitor Analysis #Financial Plans and Performance #Graph
-

Business Plan Presentation Template - World Wide Map
#Market and Competitor Analysis #Financial Plans and Performance #Graph
-

Market Sales and Profit Analysis with Bar Chart – Analysis and Insights
#Market and Competitor Analysis #Financial Plans and Performance #Graph
-

Market Analysis Graphs & Tables – Visualizing Sales Growth
#Market and Competitor Analysis #Financial Plans and Performance #Diagram
