Analysis of Crises and Opportunities through Graphs
RJ0800003_24
- Last Update 07/31/2025
- File Size 0.5MB
- # of Slides 2
- File Format PPTX
- Slide Ratio 16:9
- Color
Keywords
- #Content-Based Slides
- #Design-Based Slides
- #Market and Competitor Analysis
- #Financial Plans and Performance
- #Graph
- #Market Analysis
- #Sales and Revenue
- #Column
- #Column Chart
- #16:9
- #horizontal bar chart PowerPoint
- #crisis opportunity analysis slides
- #comparative data visualization
- #positive negative values chart
- #bar graph PowerPoint template download
About the Product
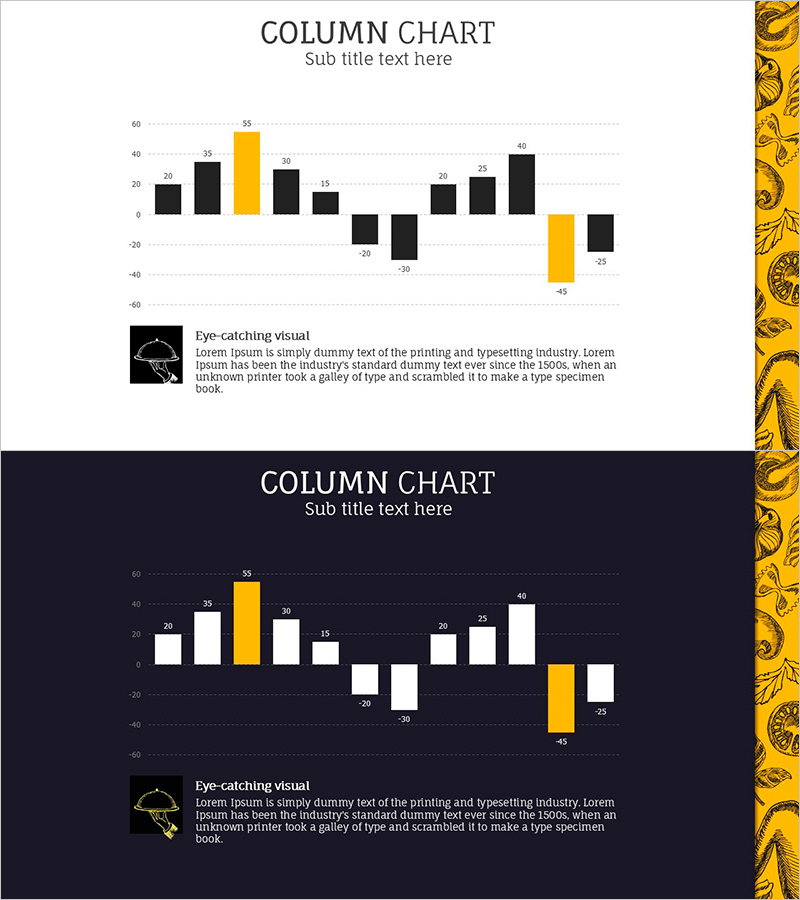
A 2-slide PowerPoint presentation featuring horizontal bar charts designed to visualize crisis and opportunity analysis. The slides use black, yellow, and white bars to distinguish positive, negative, and neutral data points, with the ability to display both positive and negative values simultaneously. Ideal for competitive market analysis, financial performance comparison, and risk assessment in business presentations. Two versions provided—light background and dark background—allowing you to choose based on your presentation environment and audience setting.
Usage Points
-
Main Usage
Visualize both positive and negative factors in market analysis, competitive benchmarking, and financial performance reviews. The dual-axis design clearly presents opportunities and risks side-by-side for informed decision-making.
-
How to Use
Replace bar values with your actual data and update axis labels and legend text to match your presentation topic. Use the light background version for small meeting rooms and the dark background version for large-screen presentations.
-
Recommended For
Executive reports, strategic planning meetings, investor presentations, market analysis briefings, financial performance reviews, and any data-driven business presentation requiring comparative analysis of positive and negative factors.
-
Slide Structure
2-slide set: Slide 1 features light background with black and yellow bars (8–10 data items); Slide 2 features dark background with white and yellow bars in identical structure. Both slides display horizontal axis range from -60 to +60 with data labels included.
Related Products
-

Market Sales and Profit Analysis with Bar Chart – Analysis and Insights
#Market and Competitor Analysis #Financial Plans and Performance #Graph
-

Geometry PPT Template Wide Vertical Bar Chart – Market Analysis Tool
#Market and Competitor Analysis #Financial Plans and Performance #Graph
-

Renewable Energy Market Analysis Horizontal Bar Chart – Successful Strategies for Carbon Neutrality
#Market and Competitor Analysis #Financial Plans and Performance #Corporate Social Responsibility
-

Market Analysis Graphs & Tables – Visualizing Sales Growth
#Market and Competitor Analysis #Financial Plans and Performance #Diagram
