Market Sales and Profit Analysis with Bar Chart – Analysis and Insights
RJ0400004_18
- Last Update 05/18/2025
- File Size 1.2MB
- # of Slides 2
- File Format PPTX
- Slide Ratio 16:9
- Color
Keywords
- #Content-Based Slides
- #Design-Based Slides
- #Market and Competitor Analysis
- #Financial Plans and Performance
- #Graph
- #Market Analysis
- #Sales and Revenue
- #Column
- #Column Chart
- #16:9
- #vertical bar chart PowerPoint
- #bar graph slide template
- #sales analysis chart
- #profit comparison graph
- #dual-series bar chart template
- #how to create bar chart in PowerPoint
About the Product
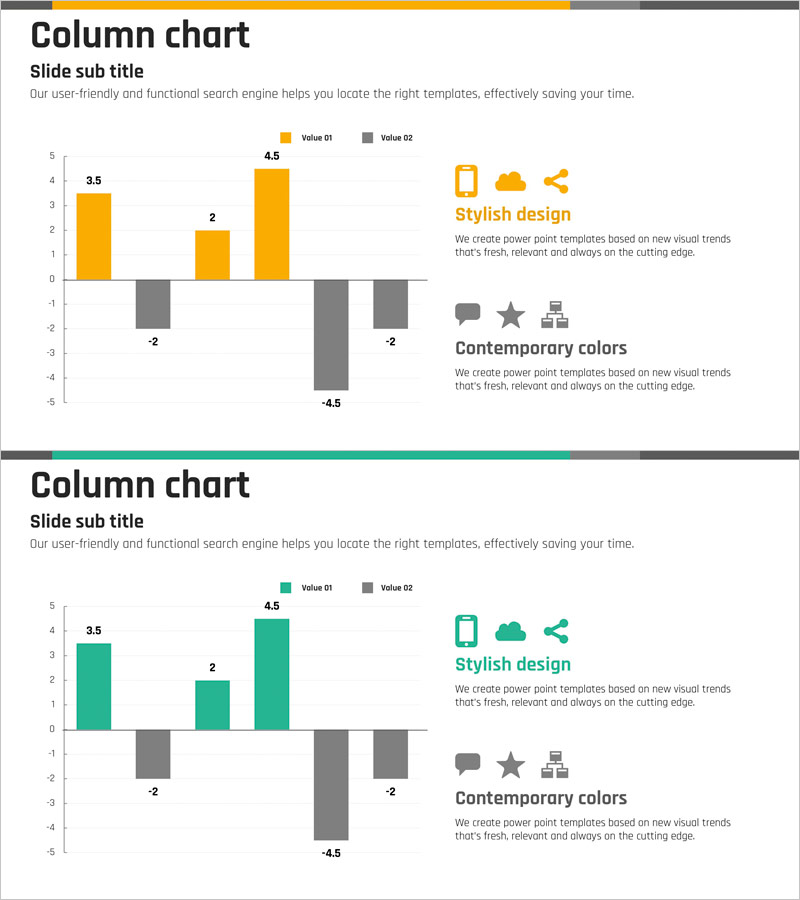
A vertical bar chart PowerPoint slide designed to compare market sales and profit data with dual-series visualization. This presentation template effectively displays both positive and negative values across four data points, making it ideal for financial reports, performance analysis, and business presentations. The color scheme features orange and gray bars for clear data differentiation, optimized for 16:9 widescreen format. Comprising 2 slides in PPTX format, all values, labels, and colors are fully editable to match your specific data and branding requirements.
Usage Points
-
Main Usage
Visually compare market sales and profit metrics while simultaneously displaying positive and negative values to clearly communicate performance trends. Effectively highlights key financial figures in reports, performance evaluations, and business presentations.
-
How to Use
Replace the sample values (3.5, 2, 4.5, -2, -4.5) with your actual data, update the legend labels (Value 01 and Value 02) to match your categories, and adjust colors and axis labels to align with your presentation context and corporate branding.
-
Recommended For
Finance teams, executives, and marketing departments presenting quarterly or annual performance results. Ideal for business plans, investment pitch decks, and any presentation requiring comparative financial analysis or performance metrics visualization.
-
Slide Structure
2-slide deck featuring identical dual-series vertical bar chart layouts. Each slide displays orange (Value 01) and gray (Value 02) bars representing positive and negative values across four data categories, with descriptive text areas for design highlights and color scheme explanation on the right side.
Related Products
-

Geometry PPT Template Wide Vertical Bar Chart – Market Analysis Tool
#Market and Competitor Analysis #Financial Plans and Performance #Graph
-

Renewable Energy Market Analysis Horizontal Bar Chart – Successful Strategies for Carbon Neutrality
#Market and Competitor Analysis #Financial Plans and Performance #Corporate Social Responsibility
-

Market Analysis Graphs & Tables – Visualizing Sales Growth
#Market and Competitor Analysis #Financial Plans and Performance #Diagram
-

Business Plan Presentation Template - World Wide Map
#Market and Competitor Analysis #Financial Plans and Performance #Graph
