Geometry Pattern Wide Line Chart PowerPoint Template - Market Trends and Competitor Analysis
RJ0200034_11
- Last Update 04/07/2025
- File Size 0.1MB
- # of Slides 2
- File Format PPTX
- Slide Ratio 16:9
- Color
Keywords
- #Content-Based Slides
- #Design-Based Slides
- #Market and Competitor Analysis
- #Graph
- #Competitor Analysis
- #Industry Trends
- #Line
- #Line Chart
- #16:9
- #line chart PowerPoint slide
- #dual-series data visualization
- #market trend analysis chart
- #competitor comparison graph
- #business metrics presentation template
About the Product
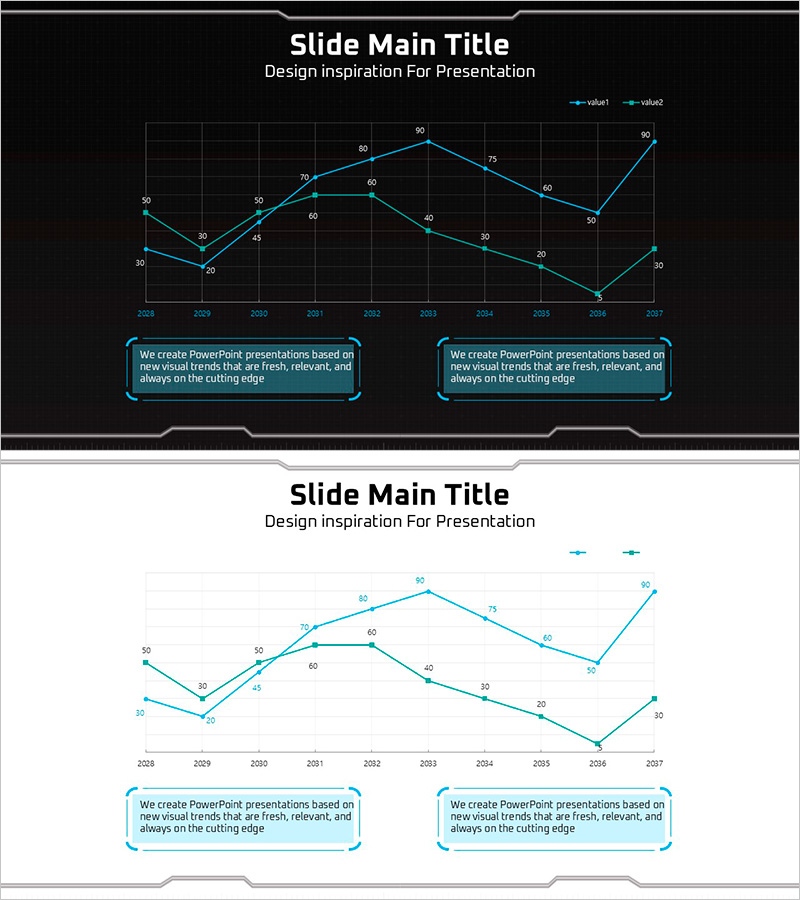
A professional line chart PowerPoint slide featuring two data series displayed in cyan against a dark background, ideal for comparing market trends, competitor performance, and business metrics over time. The slide presents 10 data points spanning from 2028 to 2037, with each value clearly labeled for precise information delivery. The geometric pattern background adds visual sophistication while maintaining clarity for projection environments. This 2-slide set includes dual callout text boxes for annotations and insights, making it perfect for executive presentations, quarterly reports, and strategic analysis decks.
Usage Points
-
Main Usage
Designed to compare two data series simultaneously over a time period, making it ideal for tracking market trends, competitive benchmarking, sales performance, customer satisfaction metrics, and technical performance indicators. The dual-line format enables stakeholders to identify correlations, divergences, and patterns between datasets at a glance.
-
How to Use
Simply replace the existing data points and labels with your actual figures. The high-contrast dark background ensures visibility in projection environments, while the geometric pattern background provides visual balance. The two-slide format allows you to present multiple scenarios or comparative analyses sequentially, with dedicated text boxes below each chart for contextual explanations.
-
Recommended For
Executive dashboards, quarterly business reviews, market analysis presentations, competitive strategy meetings, investor relations materials, marketing performance reports, sales forecasting decks, technical performance benchmarking, and strategic planning sessions. Suitable for any data-driven business presentation requiring multi-series trend comparison.
-
Slide Structure
2-slide template featuring dual-series line charts with 10 data points (2028–2037) per slide. Each slide includes two cyan-colored lines with labeled data points, a legend (value1, value2), gridlines for reference, and two callout text boxes at the bottom for annotations. Dark background with geometric pattern overlay creates professional visual hierarchy.
Related Products
-

Market Trend Performance Trend Analysis Graph – Insights and Trends
#Market and Competitor Analysis #Graph #Competitor Analysis
-

Market Trend Analysis Broken Line Graph – Competitor Analysis
#Market and Competitor Analysis #Diagram #Graph
-

Competitive Market Trend Analysis Graph – Visualizing Market Trends
#Market and Competitor Analysis #Graph #Competitor Analysis
-

Market Trend Analysis Charts & Diagrams – Essential Tool for Competitor Analysis
#Market and Competitor Analysis #Graph #Competitor Analysis
