National Trend Change Graph Visualization – Horizontal Bar Chart
RJ0800019_22
- Last Update 08/04/2025
- File Size 4.1MB
- # of Slides 2
- File Format PPTX
- Slide Ratio 16:9
- Color
Keywords
- #Content-Based Slides
- #Design-Based Slides
- #Market and Competitor Analysis
- #Graph
- #Other
- #Future Outlook
- #Industry Trends
- #Horizontal Bar
- #Segmented Horizontal Bar
- #Map
- #16:9
- #world map PowerPoint slide
- #horizontal bar chart template
- #country trend visualization
- #market analysis PPT
- #competitive analysis slide
- #year-over-year comparison graph
About the Product
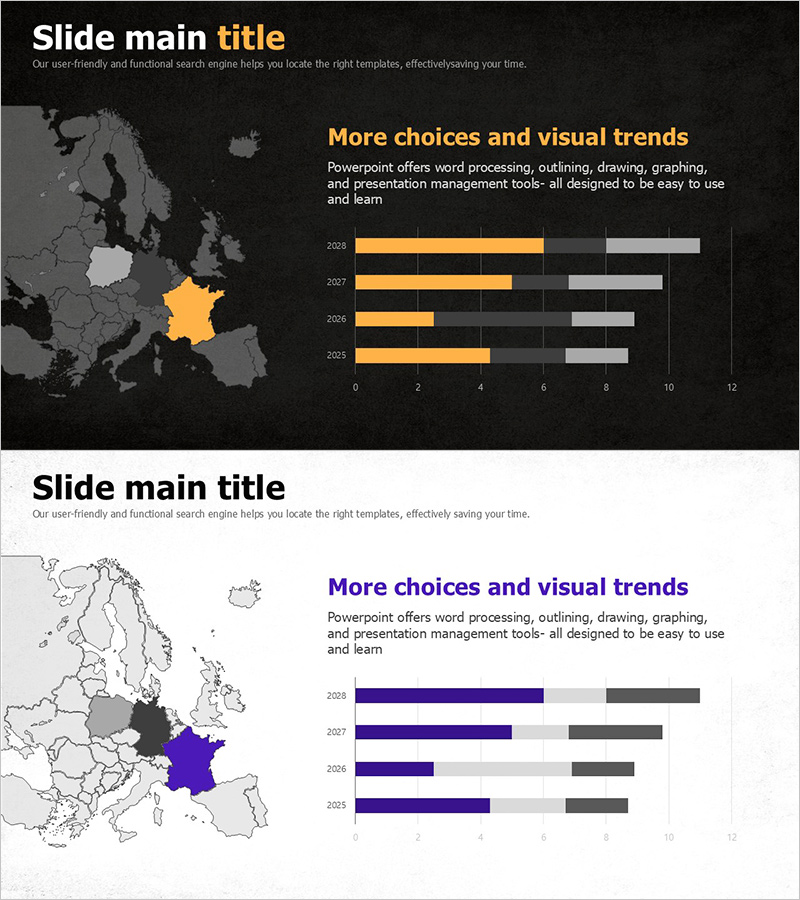
A 2-slide PowerPoint presentation set visualizing national trend changes across years. The first slide features a dark background with an orange-highlighted world map and horizontal bar charts comparing data from 2025 to 2028, while the second slide presents the same layout with a navy color scheme on a light background. Each year displays three data series represented by bar lengths, enabling quick comparison of market trends, competitive analysis, and country-specific performance metrics. Delivered in 16:9 widescreen PPTX format for seamless compatibility across all presentation environments.
Usage Points
-
Main Usage
Designed to compare and analyze country or regional trend changes over time. By highlighting specific nations on the world map and displaying corresponding year-by-year performance through horizontal bar graphs, it provides instant insight into global market conditions and competitive positioning.
-
How to Use
Use the first slide for dark-themed presentations and the second for light-themed environments. Modify bar lengths and colors to input your actual data, and customize the highlighted country on the world map to match your presentation context.
-
Recommended For
Ideal for international business strategy presentations, global market analysis reports, regional sales performance reviews, country-level competitive benchmarking, and overseas expansion strategy discussions.
-
Slide Structure
2-slide layout. Each slide positions a world map on the left (with one country highlighted in accent color) and a horizontal bar chart on the right displaying 4 years (2025–2028) × 3 data series. Available in both dark and light background options for flexible presentation environment adaptation.
Related Products
-

Bar Chart of Bike Exercise – Market Trends and Future Outlook
#Market and Competitor Analysis #Graph #Future Outlook
-

100% Stacked Bar Chart Abstract Pattern Presentation
#Market and Competitor Analysis #Graph #Other
-

Stacked Bar Chart by Country – Visualizing Market Trends
#Market and Competitor Analysis #Graph #Other
-

Horizontal Bar Chart Slide for Four-Year Change Figures
#Market and Competitor Analysis #Graph #Industry Trends
