Organize Financial Plans with Abstract Pattern Template
RJ0200033_28
- Last Update 04/07/2025
- File Size 0.2MB
- # of Slides 2
- File Format PPTX
- Slide Ratio 16:9
- Color
Keywords
- #Content-Based Slides
- #Design-Based Slides
- #Financial Plans and Performance
- #Diagram
- #Balance Sheet
- #Key Financial Indicators
- #Table
- #Standard Table
- #16:9
- #data table PowerPoint slide
- #financial information template
- #business data presentation
- #5-column table slide
- #how to organize data in PowerPoint
About the Product
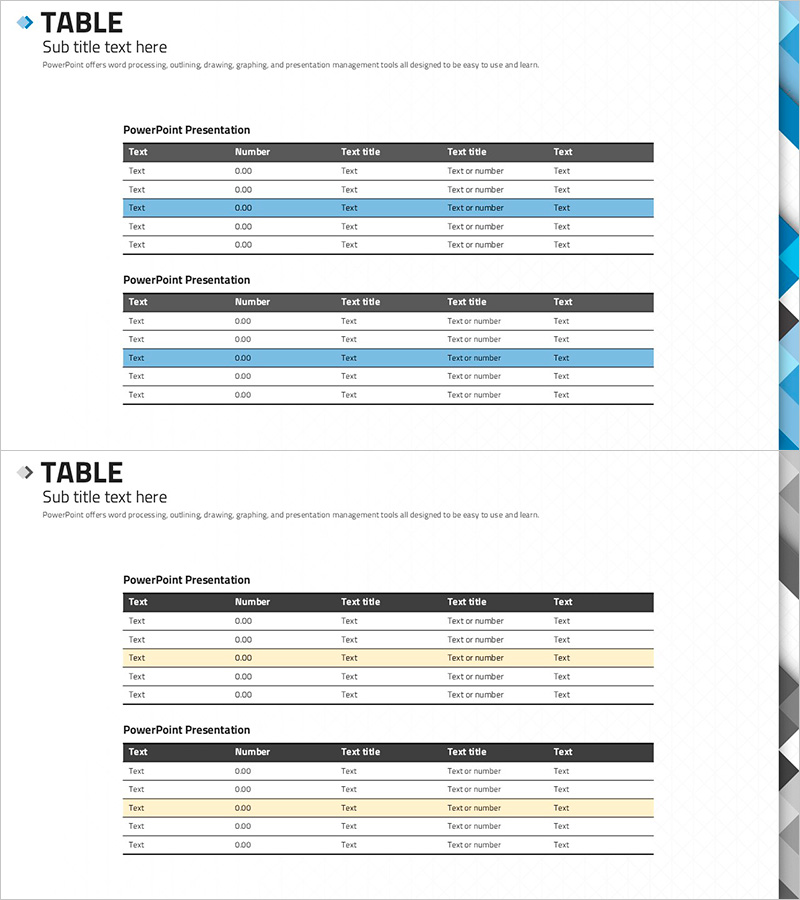
A professional 5-column table PowerPoint slide designed for organizing financial plans and business data with clarity and impact. Features a dark header row paired with light body rows, creating strong visual hierarchy for easy information scanning. Row-level highlighting in blue and yellow emphasizes critical data points and draws attention to key metrics. Ideal for financial reports, business plans, marketing analysis, and quarterly performance reviews. The 2-slide set allows multiple datasets to be presented cohesively, while the 16:9 widescreen format ensures compatibility with modern presentation environments and large-scale displays.
Usage Points
-
Main Usage
Present quantitative data—financial figures, sales metrics, market analysis—in a structured table format that enhances clarity and retention. The dark header and row-level color coding guide the audience's eye to critical information, making complex datasets immediately digestible.
-
How to Use
Populate each of the two slides with different datasets for comparative analysis, or use them sequentially to build a narrative around the same data from multiple angles. Leverage the blue and yellow row highlighting to instantly emphasize key performance indicators or outlier values during live presentation.
-
Recommended For
CFOs and finance teams presenting quarterly earnings and budget forecasts; marketing managers analyzing channel performance and ROI; sales leaders tracking customer accounts and pipeline value; executives preparing strategic decision-making materials. Suitable for any data-driven business presentation requiring professional table layouts.
-
Slide Structure
Two-slide set, each containing a 5-column × 5-row table (columns: Text, Number, Text Title, Text Title, Text). Header row in dark gray; data rows alternate between white, light blue, and light yellow for visual distinction. Optimized for 16:9 widescreen displays and standard business projectors.
Related Products
-

Simple Yellow Purple Table – Financial Performance Visualization
#Financial Plans and Performance #Diagram #Balance Sheet
-

Green Brown Statistics Table – Financial Performance Analysis
#Financial Plans and Performance #Diagram #Balance Sheet
-

Sleek Diagram and Chart Design
#Financial Plans and Performance #Diagram #Balance Sheet
-

Modern Blue Table Chart Presentation Template
#Financial Plans and Performance #Diagram #Balance Sheet
