Green Brown Statistics Table – Financial Performance Analysis
RJ0900033_29
- Last Update 08/26/2025
- File Size 0.2MB
- # of Slides 2
- File Format PPTX
- Slide Ratio 16:9
- Color
Keywords
- #Content-Based Slides
- #Design-Based Slides
- #Financial Plans and Performance
- #Diagram
- #Balance Sheet
- #Key Financial Indicators
- #Table
- #Standard Table
- #16:9
- #table PowerPoint slide
- #data comparison presentation
- #financial performance analysis template
- #statistics table template
- #three-column data table
About the Product
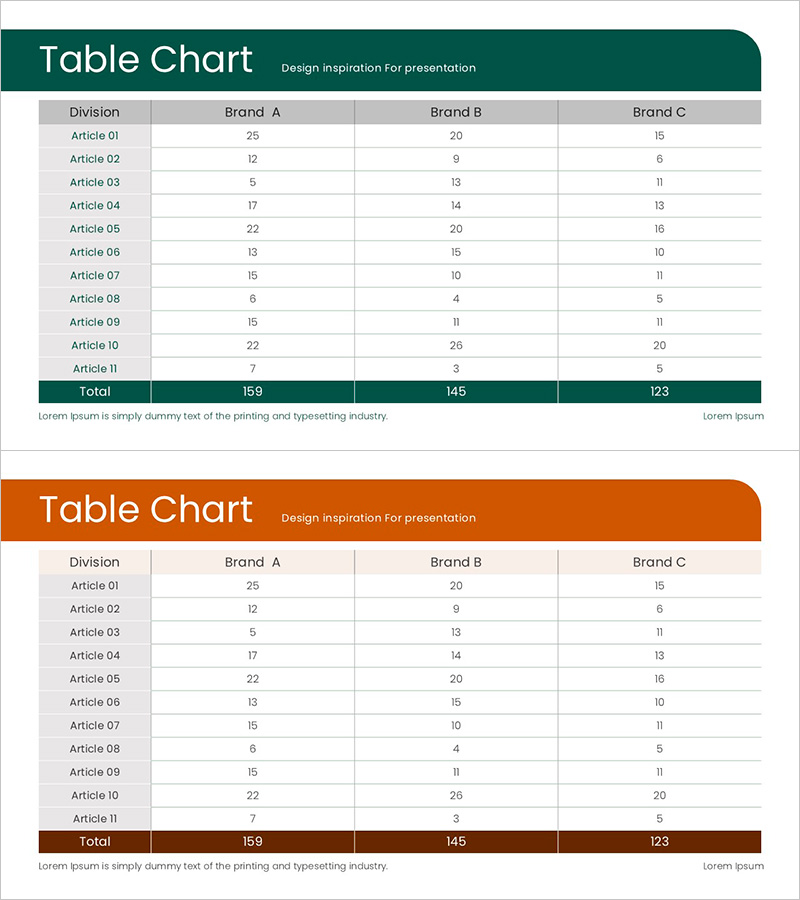
A professional three-column data comparison table PowerPoint slide optimized for financial performance analysis and comparative reporting. Two design versions are provided with dark teal and brown header styling, each displaying numerical data for 11 items across three categories (brands, departments, or product lines). The row-based layout clearly separates each data entry, making it ideal for quarterly and annual performance comparisons, departmental results analysis, and product line sales tracking. A highlighted total row enables viewers to grasp overall scale at a glance while understanding individual contributions. The fully editable PPTX format allows immediate integration into presentations and reports.
Usage Points
-
Main Usage
Presents quantitative data such as financial results, sales figures, and departmental performance across three categories while emphasizing totals to communicate both overall scale and individual item contributions simultaneously.
-
How to Use
Input actual financial figures, revenue data, or performance metrics into the table for use in quarterly and annual comparison reports, investor presentations, executive briefings, and business plan announcements. Header colors and fonts are fully customizable to match corporate branding.
-
Recommended For
Finance teams, executives, and business managers presenting quarterly or annual results; marketing teams analyzing product line sales performance. Ideal for investor relations presentations, business plans, executive reports, and performance analysis slideshows.
-
Slide Structure
Two slide versions (teal header and brown header) each featuring a 4-column by 11-row table structure (Division column plus three data columns, with item rows and a total row). Header and total rows are color-highlighted for clear information hierarchy, with all cells as fully editable text-based table elements.
Related Products
-

Visualizing Financial Performance with Comparison Tables – Transparent Information Delivery
#Financial Plans and Performance #Diagram #Balance Sheet
-

Sleek Diagram and Chart Design
#Financial Plans and Performance #Diagram #Balance Sheet
-

Triangle Pattern PPT Table Chart – Visualizing Financial Performance
#Financial Plans and Performance #Diagram #Balance Sheet
-

Organize Financial Plans with Abstract Pattern Template
#Financial Plans and Performance #Diagram #Balance Sheet
