Abstract Pattern World Map Template – Harmony of Design and Data
RJ0200033_17
- Last Update 04/07/2025
- File Size 0.7MB
- # of Slides 2
- File Format PPTX
- Slide Ratio 16:9
- Color
Keywords
- #Content-Based Slides
- #Design-Based Slides
- #Market and Competitor Analysis
- #Financial Plans and Performance
- #Graph
- #Other
- #Target Market
- #Projected Return on Investment (ROI)
- #Circles
- #Doughnut Chart
- #Map
- #16:9
- #world map PowerPoint slide
- #global map presentation template
- #international business map
- #regional analysis slide
- #world map template download
- #geographic data visualization
About the Product
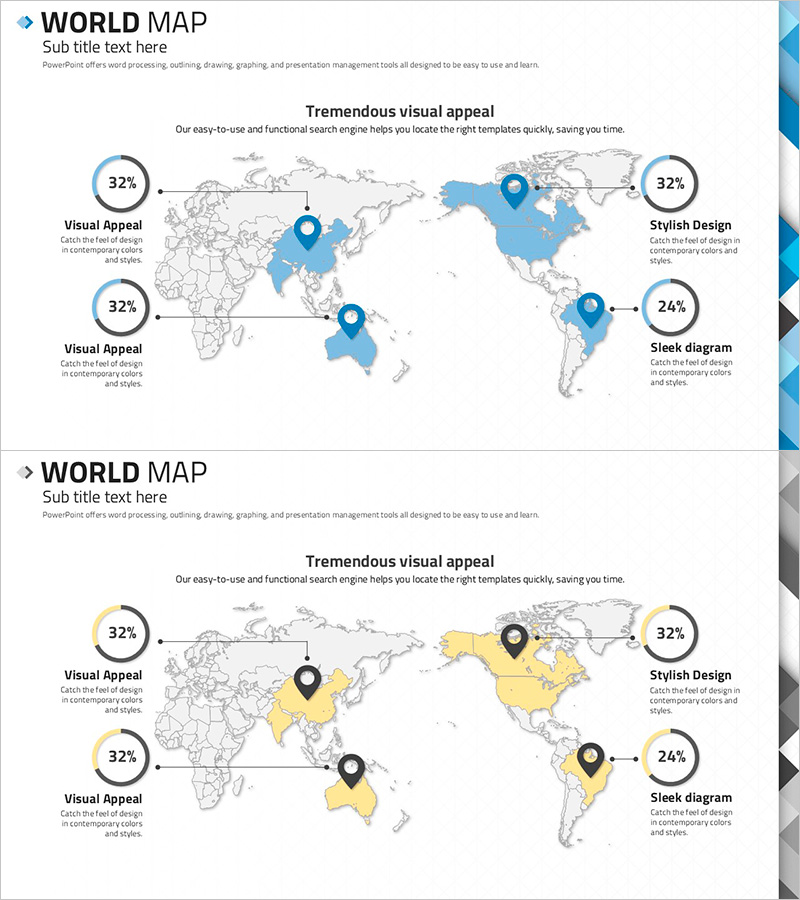
A global market analysis and international business strategy visualization slide featuring a world map in PowerPoint format. This 2-slide set provides both blue and yellow color versions, each with 4 pin markers and circular percentage badges (32%, 24%, etc.) positioned on key regions. Connecting lines link the marked locations, while text boxes on both sides allow you to input regional descriptions and metrics. Ideal for international expansion presentations, global network overviews, regional performance comparisons, and cross-border business communications. Fully editable and ready to customize with your data.
Usage Points
-
Main Usage
Visualize global business strategies, international market analysis, regional performance metrics, and global network expansion. Pin markers and connecting lines clearly communicate relationships and data flows between specific regions and markets.
-
How to Use
Enter region names and descriptions in the text boxes adjacent to each pin marker. Input metrics (revenue, growth rate, market share, etc.) in the circular percentage badges. Choose the blue version for trust and stability messaging, or yellow for growth and activity emphasis.
-
Recommended For
International business managers, marketing strategy teams, investor pitch presentations, global expansion reports, regional sales performance analysis, and any role or presentation requiring cross-border or multi-region data visualization.
-
Slide Structure
2-slide set. Each slide features a world map background with gray outline style, 4 blue or yellow pin markers positioned on key regions, circular percentage badges near each pin, and text input areas on left and right sides. Straight connecting lines between pins represent inter-regional relationships and data flows.
Related Products
-

Global Food Distribution Map – Insight into the Market
#Company Introduction #Market and Competitor Analysis #Graph
-

Orange Hexagon Template World Map – Market Analysis Insights
#Market and Competitor Analysis #Graph #Other
-

Target Area Status Analysis Graph – Data and Insights
#Company Introduction #Market and Competitor Analysis #Graph
-

Donut Chart in Overseas Markets – Market Share Analysis
#Market and Competitor Analysis #Graph #Other
