Eco-friendly Icon Bar Graph Slide
RJ0600026_26
- Last Update 06/27/2025
- File Size 0.3MB
- # of Slides 2
- File Format PPTX
- Slide Ratio 16:9
- Color
Keywords
- #Content-Based Slides
- #Design-Based Slides
- #Market and Competitor Analysis
- #Diagram
- #Graph
- #Competitor Analysis
- #Competitive Advantage
- #Table
- #Column
- #Standard Table
- #Grouped Column
- #16:9
- #grouped column chart PowerPoint
- #vertical bar graph template
- #5-item data comparison slide
- #comparison chart PowerPoint
- #business data visualization slide
About the Product
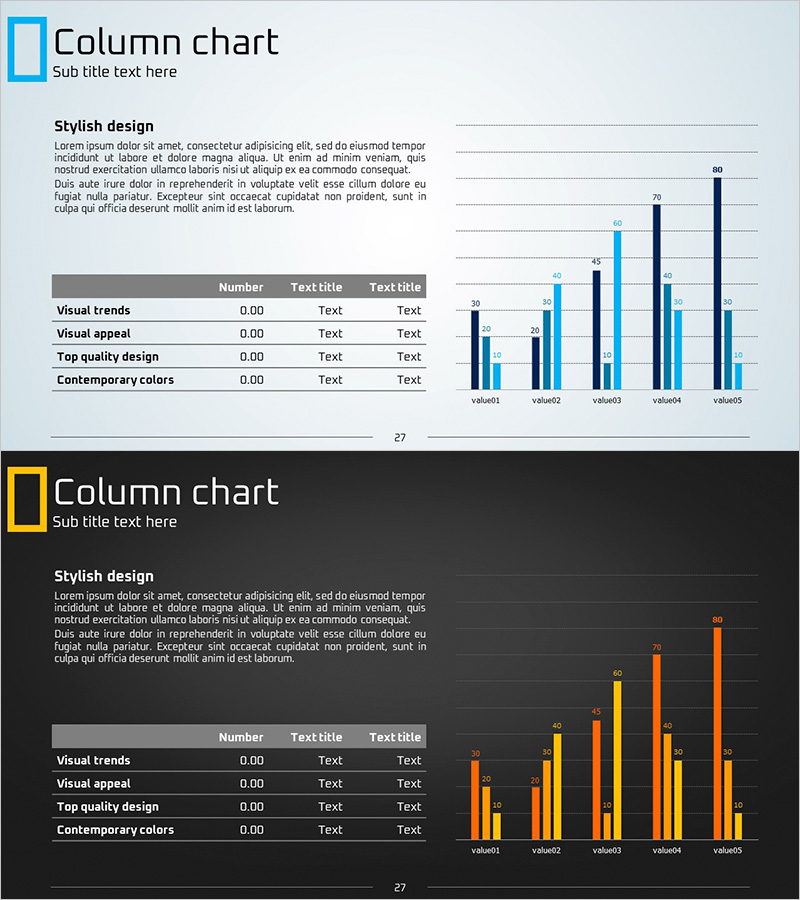
A PowerPoint slide featuring a grouped vertical bar chart comparing data across five items using light blue and orange dual-tone color scheme. Each item displays 2-3 data series simultaneously, making it ideal for presenting comparative business metrics. The template includes 2 slides optimized for 16:9 widescreen format. Perfect for market analysis, sales performance comparison, departmental results, and quarterly reports. The dual-color design helps distinguish between data series while maintaining visual clarity and professional appearance in presentations.
Usage Points
-
Main Usage
The primary purpose is to compare multiple data series across five categories and visualize numerical differences clearly. The bar heights represent data values intuitively, while the dual-tone color scheme distinguishes between different data series. Suitable for presenting market research results, quarterly sales figures, departmental KPIs, and competitive analysis.
-
How to Use
Replace the placeholder labels (value01–value05) and numbers with your actual data. The light blue and orange bars represent different data series (e.g., year-over-year comparison, team A vs. team B), so establish a clear legend. During presentation, emphasize the numerical differences between items to maintain audience engagement and highlight key insights.
-
Recommended For
Recommended for marketing managers, sales directors, financial analysts, and executives preparing performance reports. Ideal for quarterly business reviews, market trend analysis, competitive benchmarking, departmental performance evaluations, and data-driven decision-making presentations.
-
Slide Structure
Two-slide layout: the first slide features a light blue background with orange bars as focal points, while the second uses a dark gray background to emphasize the orange bars. Each slide contains a grouped column chart with five items and a text area on the left for adding analytical commentary or insights.
Related Products
-

Competitiveness Table and Chart Analysis – Market and Competitor Analysis
#Market and Competitor Analysis #Diagram #Graph
-

Visualizing Market Trends with Musician Comparison Graphs
#Market and Competitor Analysis #Diagram #Graph
-

Performance Analysis Table Slide – Market and Competitor Analysis
#Market and Competitor Analysis #Diagram #Graph
-

Competitor Analysis Vertical Comparison Graph – Insights and Performance
#Market and Competitor Analysis #Graph #Competitor Analysis
