Flowering Period Graph – Future Outlook Analysis
RJ0800011_20
- Last Update 08/02/2025
- File Size 0.4MB
- # of Slides 2
- File Format PPTX
- Slide Ratio 16:9
- Color
Keywords
- #Content-Based Slides
- #Design-Based Slides
- #Market and Competitor Analysis
- #Graph
- #Future Outlook
- #Competitive Advantage
- #Column
- #Grouped Column
- #16:9
- #grouped bar chart PowerPoint
- #horizontal vertical bar graph slide
- #3-year trend comparison
- #data visualization template
- #market analysis chart download
About the Product
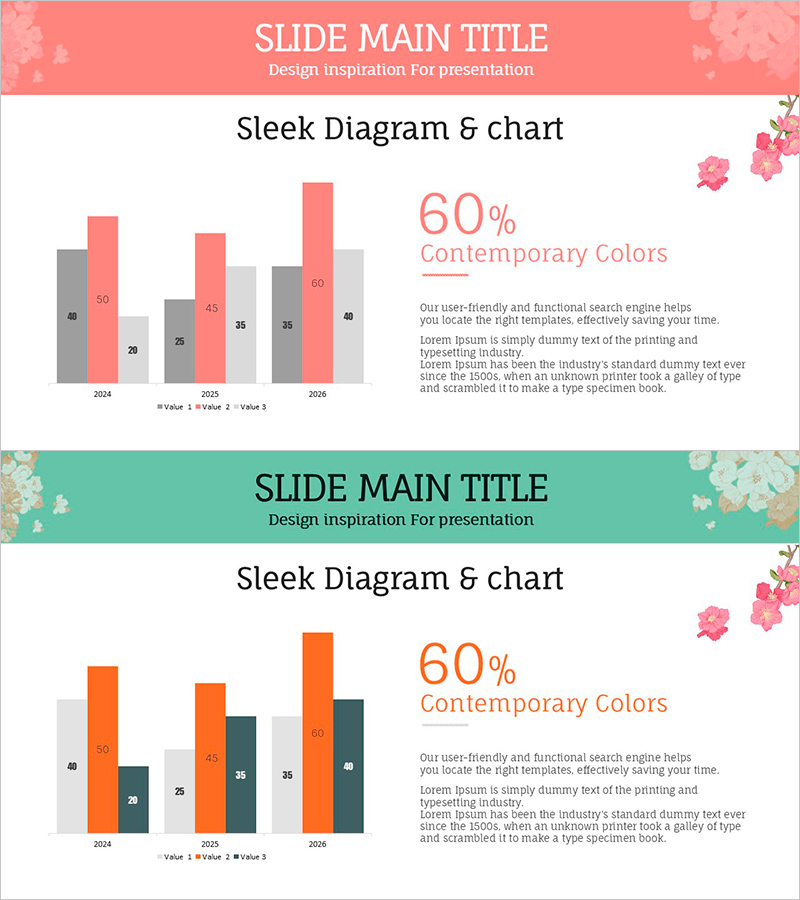
A grouped bar chart PowerPoint slide that clearly visualizes year-over-year data changes across multiple series. This presentation template displays data from 2024 to 2026 with three data series in both horizontal and vertical bar formats, making it ideal for market analysis, competitive benchmarking, performance reporting, and business presentations. The coral pink and gray color palette distinguishes data series effectively, while floral illustrations enhance the presentation aesthetic. The 2-slide set presents the same data in two different color combinations, allowing you to select the version that best matches your presentation context.
Usage Points
-
Main Usage
This data visualization slide simultaneously displays year-over-year trends and cross-series comparisons using grouped bars. With 3 years × 3 data series, the bar heights and color coding intuitively communicate market size evolution, competitive performance, departmental results, or other multi-dimensional metrics.
-
How to Use
Edit the bar heights and numerical labels with your own data for immediate use. Replace the 2024–2026 year labels and Value 1·2·3 series names to match your presentation context (revenue, customer count, market share, etc.), and select the color combination that best suits your needs.
-
Recommended For
Recommended for executive reports, business performance presentations, marketing analysis materials, investor pitch decks, and consulting proposals where comparative numerical analysis is essential. Ideal for executives, planners, analysts, and marketing professionals.
-
Slide Structure
2-slide set. Each slide features a header (coral pink background with title), body content (3 grouped horizontal bars + 3 grouped vertical bars + 60% emphasis area with descriptive text), and decorative floral elements in the upper right corner. Slide 2 presents the same data with an alternative color scheme (coral, orange, and gray).
Related Products
-

THE ROAD Presentation Table & Tied Vertical Bar Graph – Market and Competitor Analysis
#Market and Competitor Analysis #Diagram #Graph
-

Bundled Charts for Infinite Energy Analysis
#Market and Competitor Analysis #Graph #Market Status
-

Marketing Performance and Analysis – Visualizing Results with Graphs
#Market and Competitor Analysis #Graph #Text Box
-

Real Estate Market Forecast Graph – Essential Tool for Market Analysis
#Market and Competitor Analysis #Graph #Market Analysis
