Visualizing Market Share with Donut Chart – Effective Business Analysis
RJ0200032_11
- Last Update 04/06/2025
- File Size 0.4MB
- # of Slides 2
- File Format PPTX
- Slide Ratio 16:9
- Color
Keywords
- #Content-Based Slides
- #Design-Based Slides
- #Business Introduction
- #Market and Competitor Analysis
- #Graph
- #Technological Status
- #Market Share
- #Circles
- #Doughnut Chart
- #16:9
- #donut chart PowerPoint slide
- #pie chart template download
- #market share visualization
- #two-segment comparison slide
- #business analysis presentation
- #competitive analysis PowerPoint
About the Product
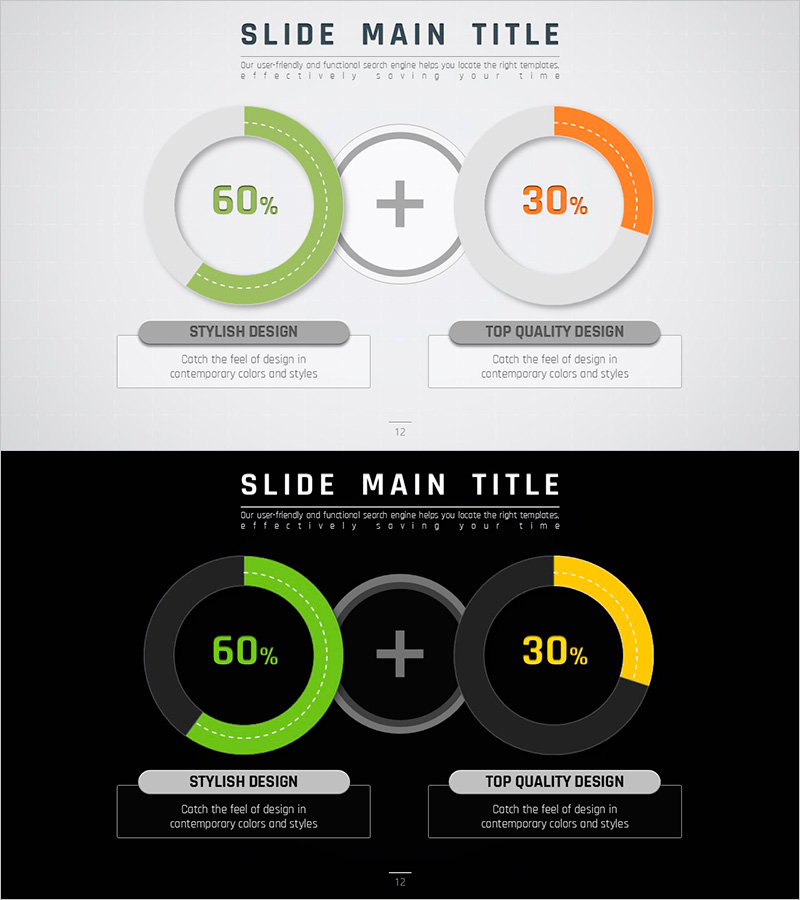
A donut chart PowerPoint slide that intuitively visualizes market share and competitive analysis with two distinct segments. The design features green and orange color segments representing different data proportions, with a central circular area for displaying key metrics. Built on a minimalist gray background layout, this slide is ideal for business analysis, technology status reports, and market competitive analysis sections. Formatted in 16:9 widescreen ratio with 2 slides, the colors and numerical values are fully editable for immediate application to various comparative datasets.
Usage Points
-
Main Usage
This slide effectively compares two major data categories such as market share percentages, technology distribution, or business segment proportions. The donut structure with a central focal area emphasizes key metrics and makes data comparison immediately clear to audiences.
-
How to Use
Apply this slide in business analysis sections to compare market share against competitors, in technology status reports to show technology adoption rates, or in business overview presentations to illustrate business composition ratios. Edit the segment colors and numerical values to represent different comparative datasets across various business contexts.
-
Recommended For
Business analysts, marketing professionals, executive report presenters, and investment pitch teams benefit from this template. It is suitable for any business presentation requiring clear visual comparison of two primary data categories or market segments.
-
Slide Structure
The template consists of 2 slides, each displaying two donut charts side by side. The left chart features a green segment (60%), the right chart displays an orange segment (30%), connected by a plus symbol in the center. Label areas below each chart allow for descriptive text and legend information.
Related Products
-

Pie Chart for Data Comparison – Quality and Color
#Business Introduction #Market and Competitor Analysis #Graph
-

Donut Graph by Caries Erosion Status – Essential for Market Analysis
#Business Introduction #Market and Competitor Analysis #Graph
-

Doughnut Chart Visualizing Market Share by Exercise
#Business Introduction #Market and Competitor Analysis #Graph
-

Scientific Analysis Donut Circle Graph
#Business Introduction #Market and Competitor Analysis #Graph
